Wirefrmaning and Design Project: Cisco live 2013 social media hub

Objective
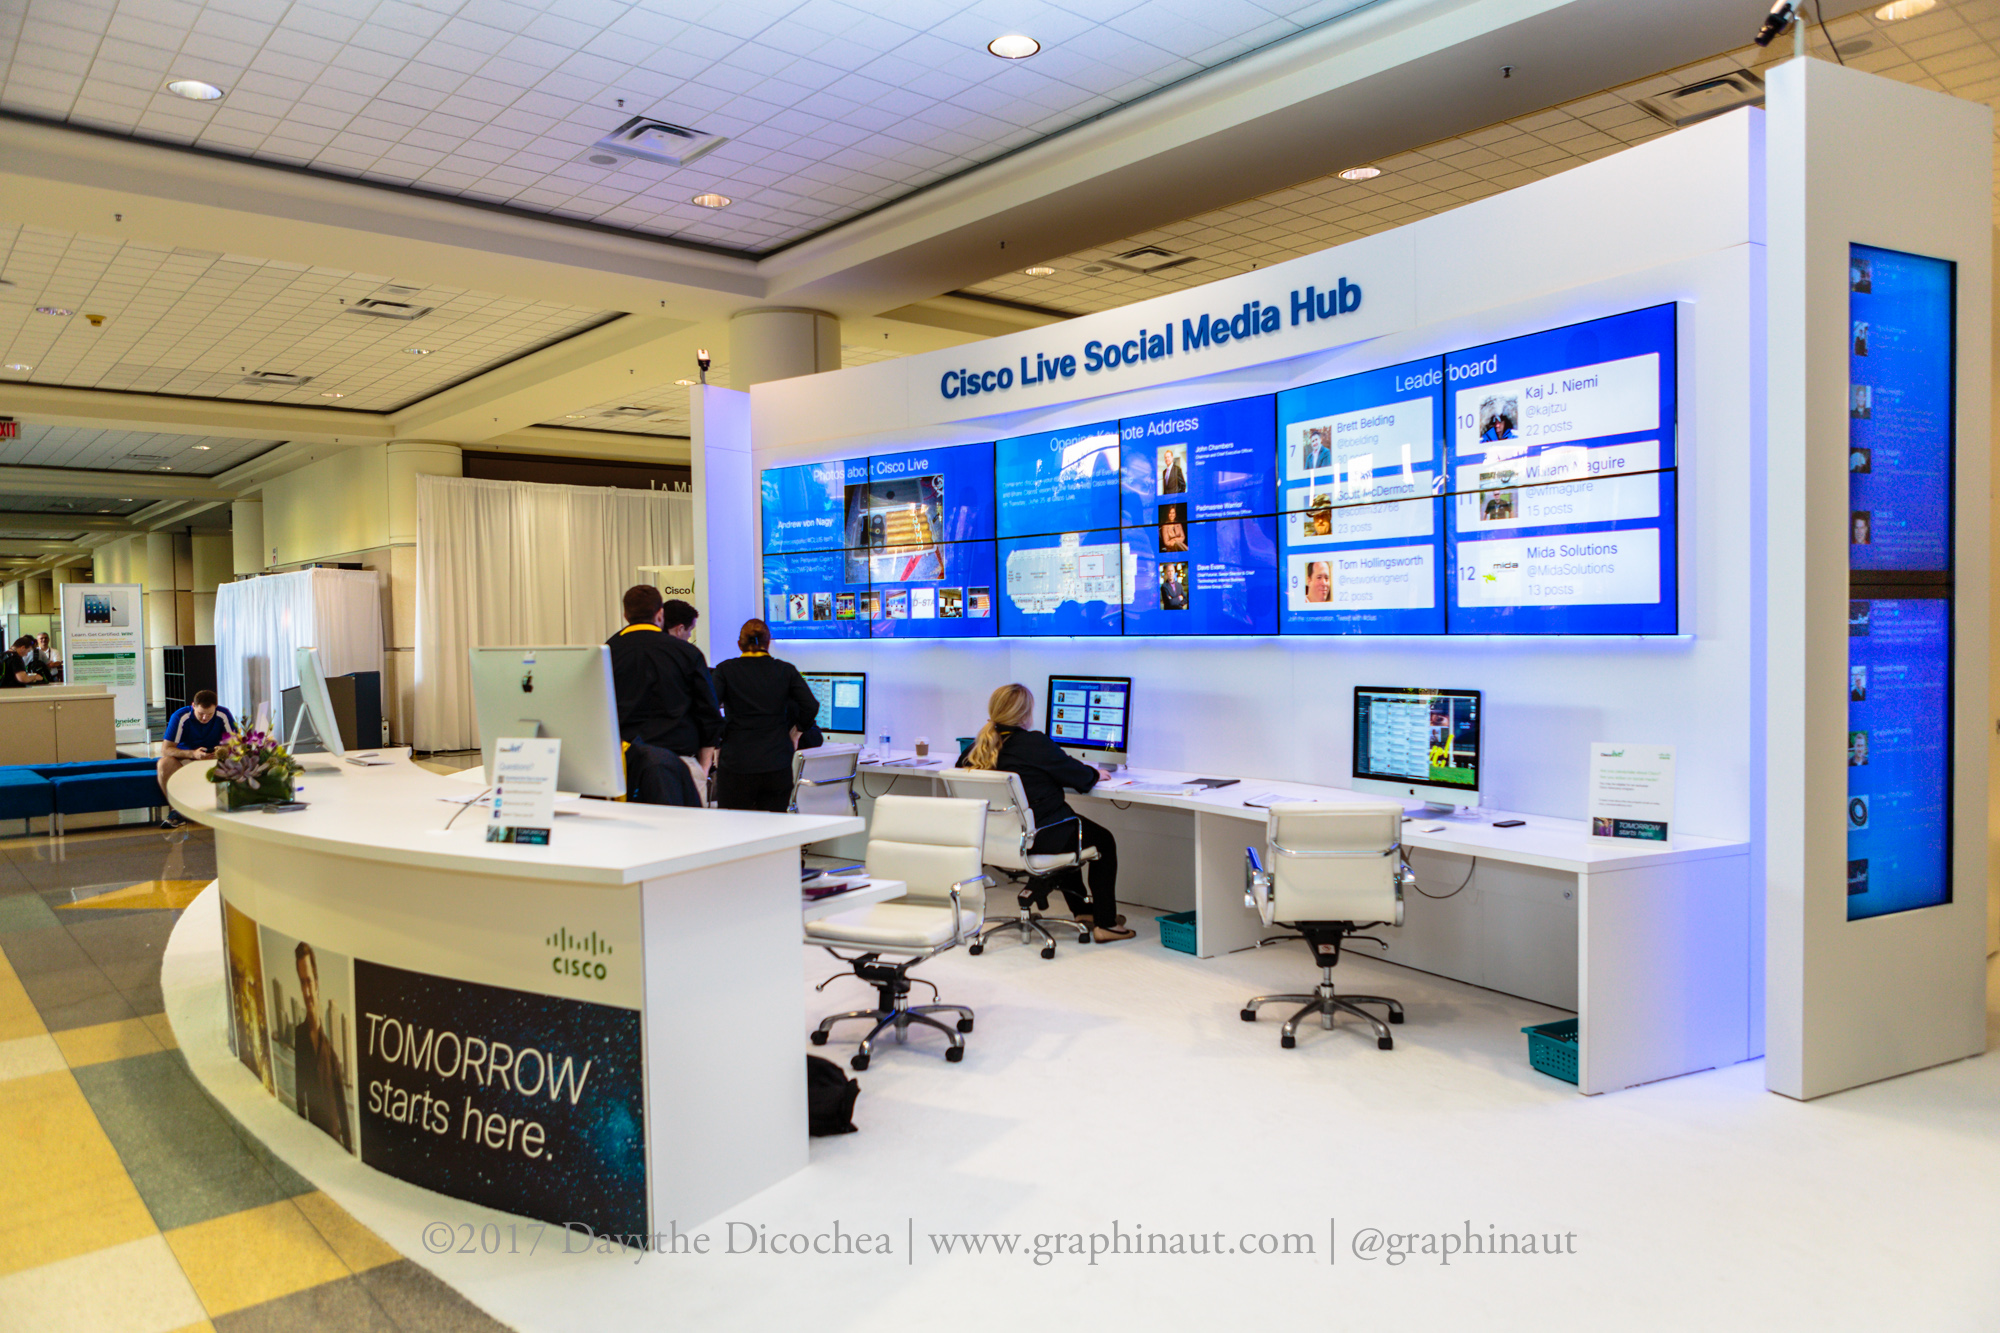
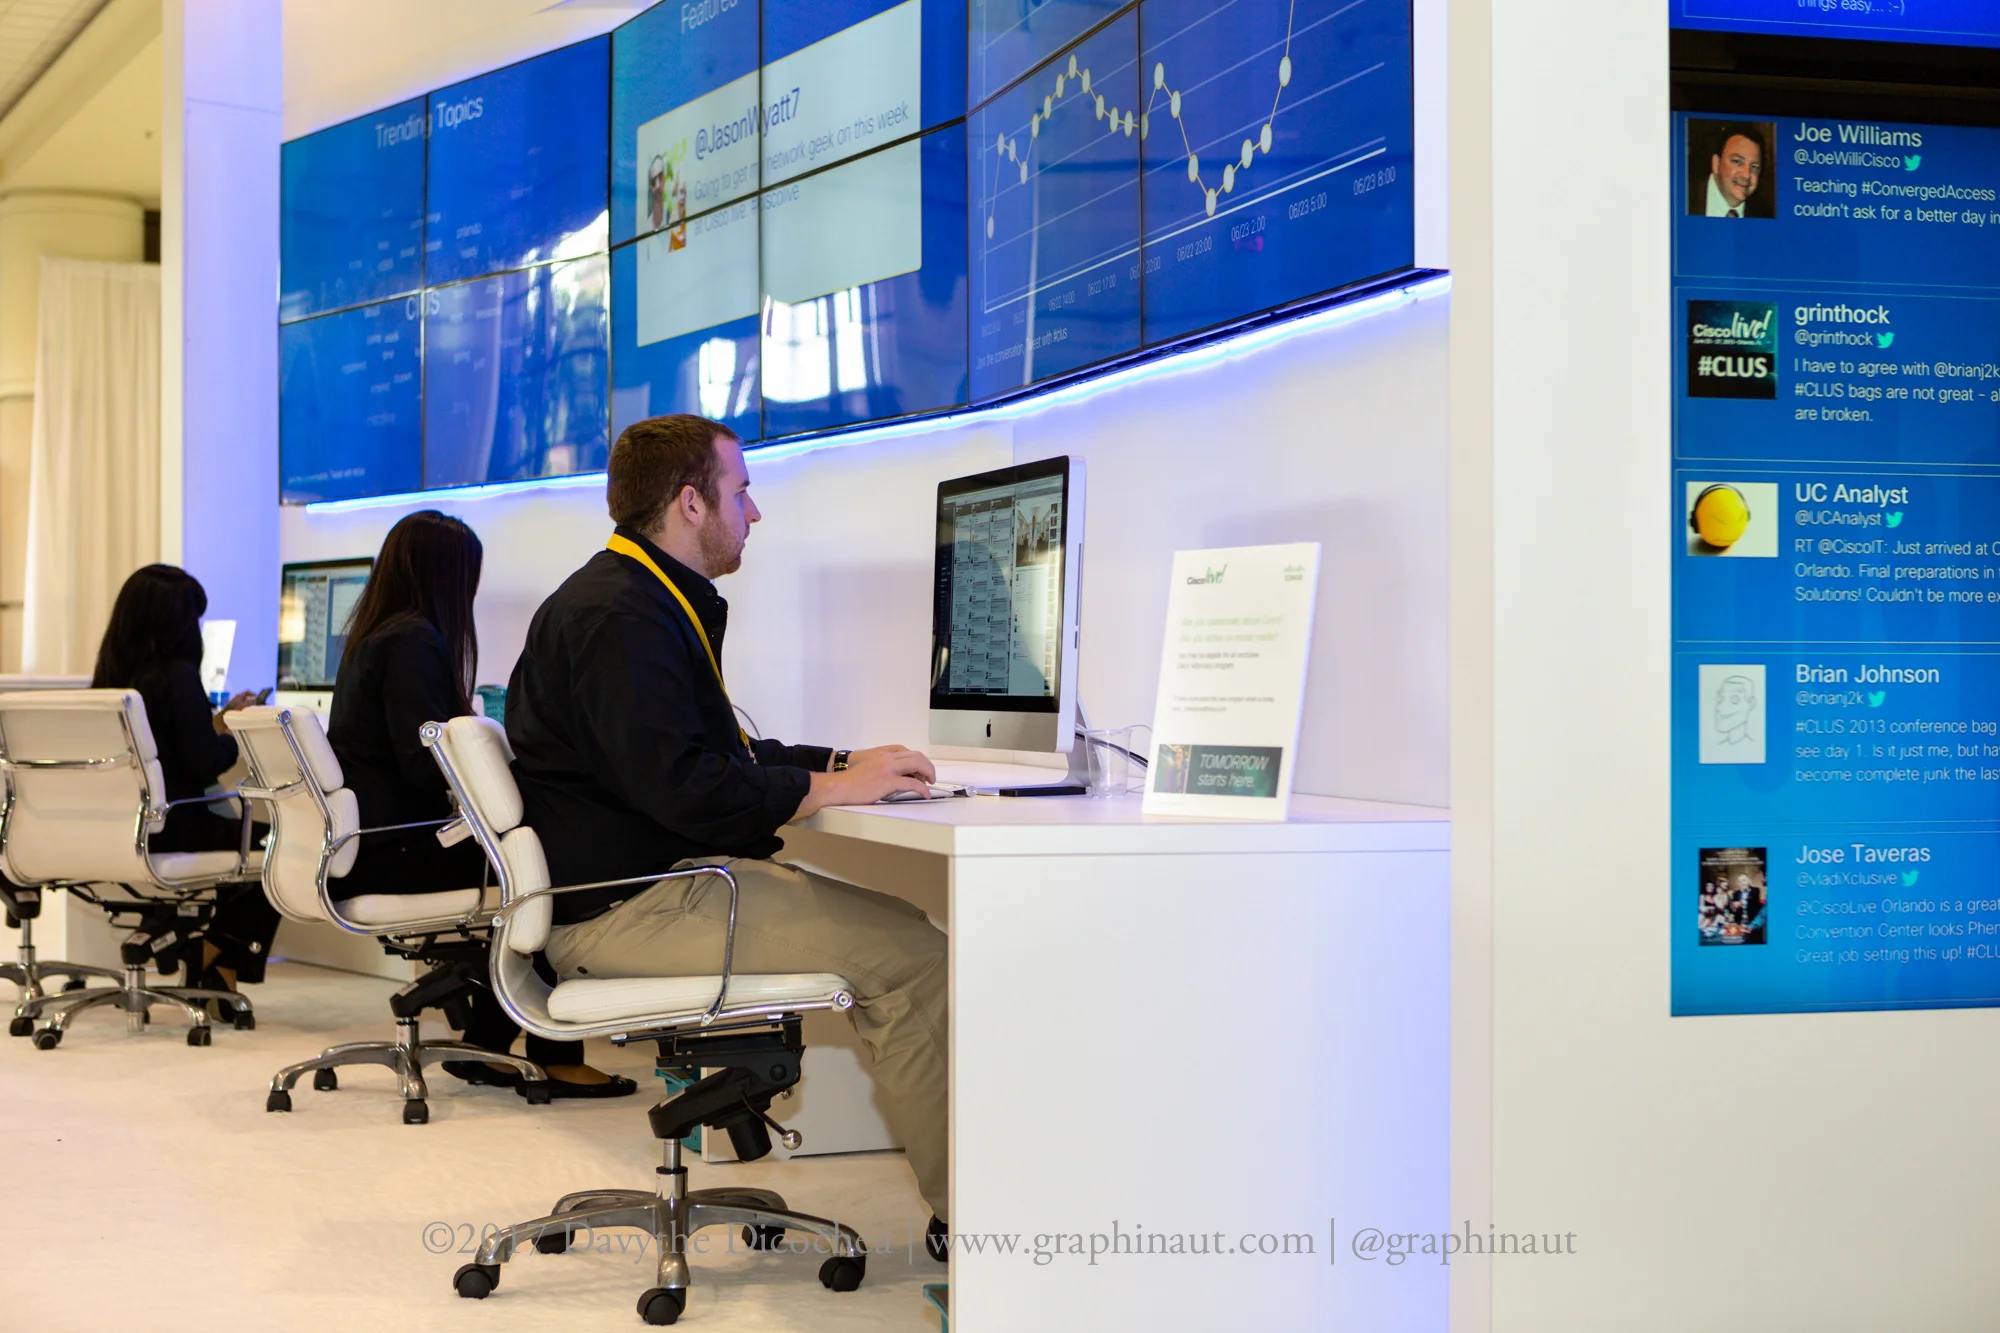
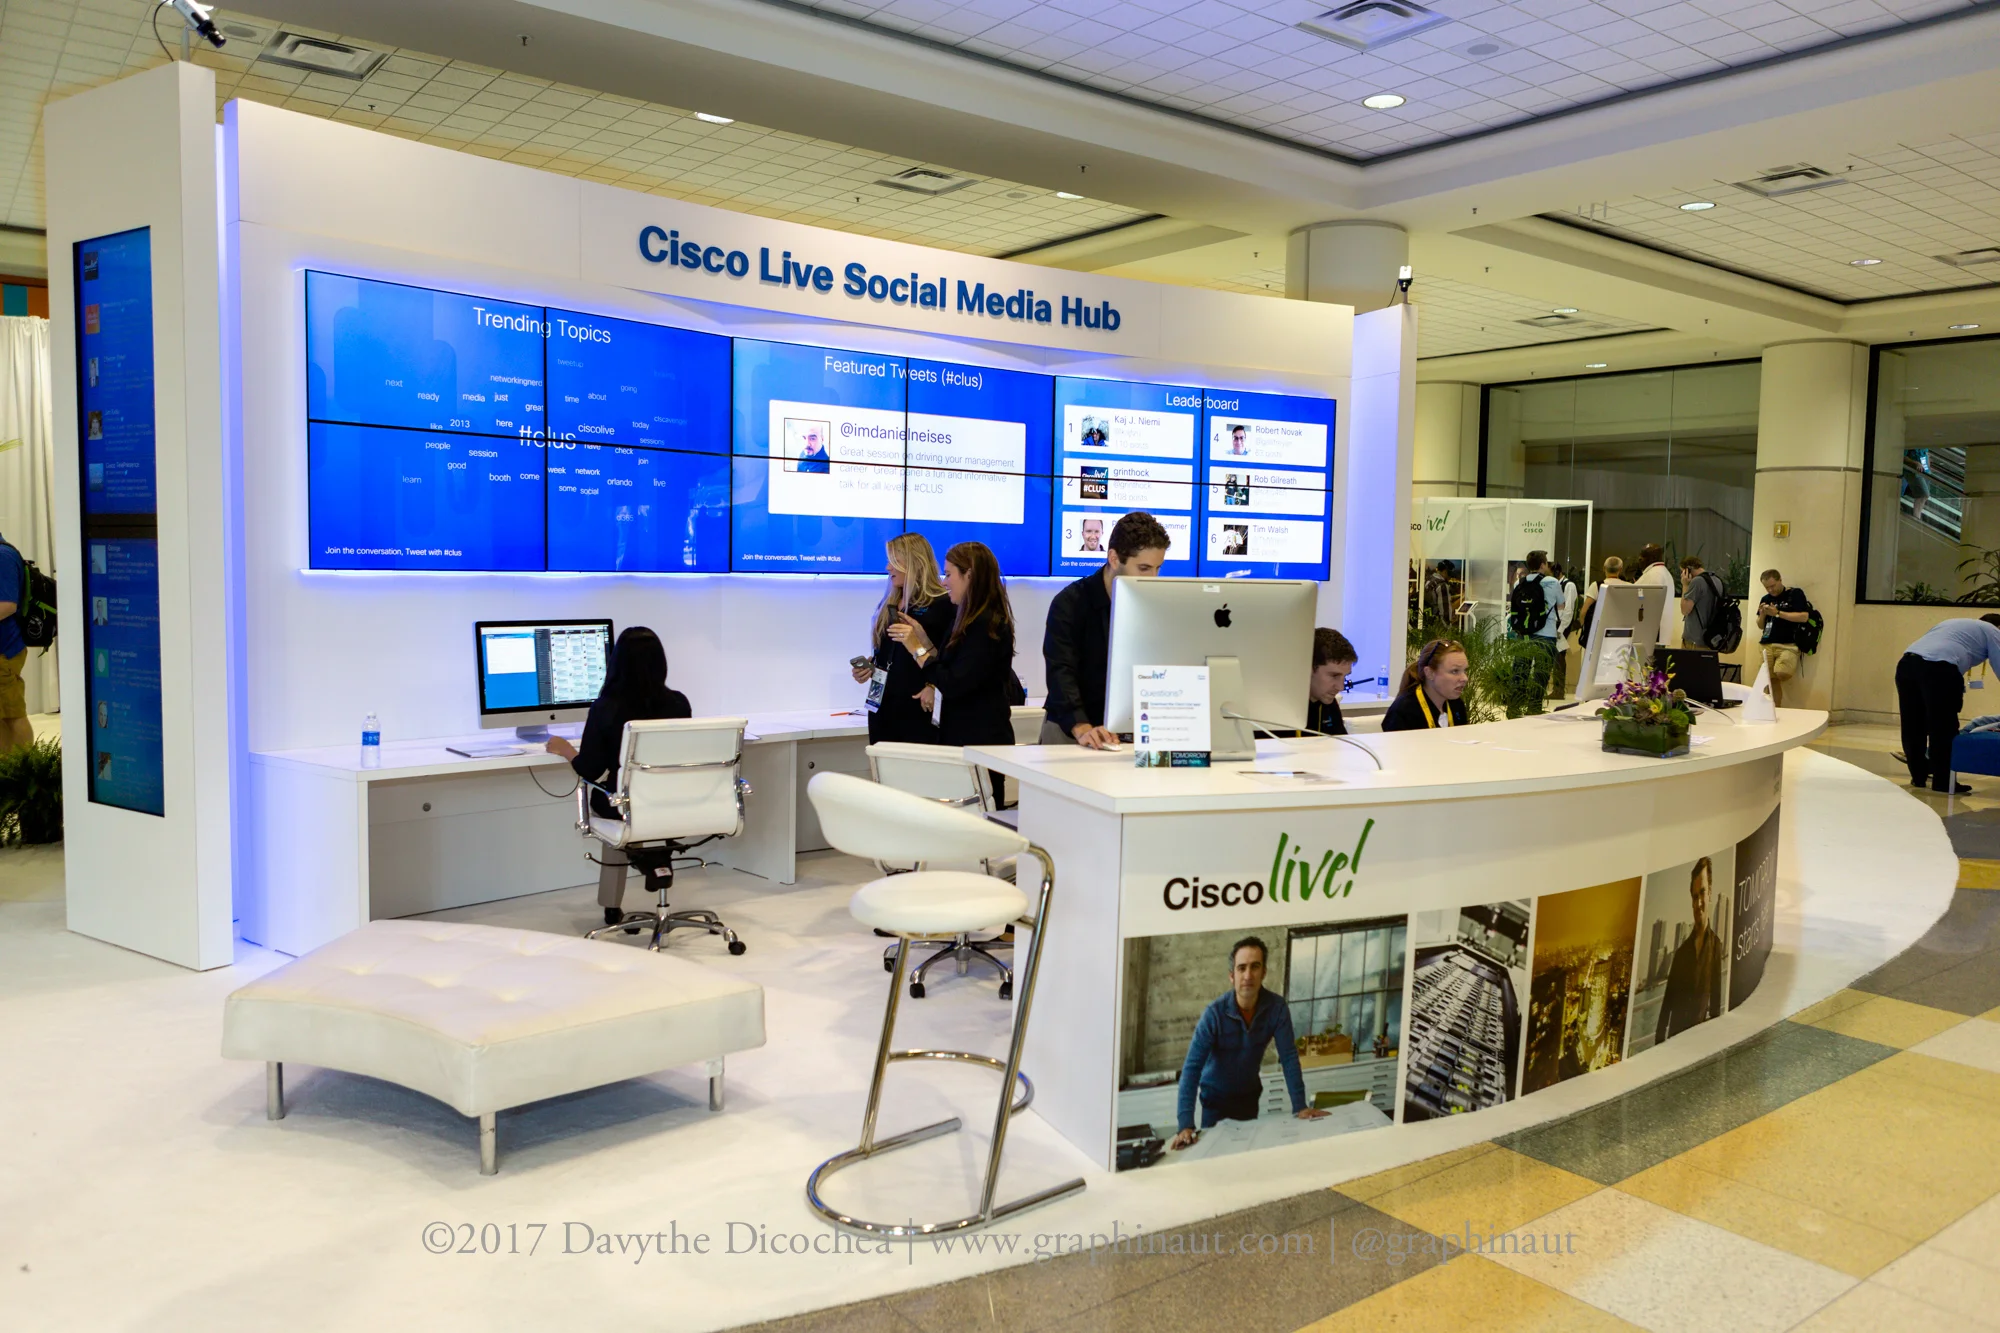
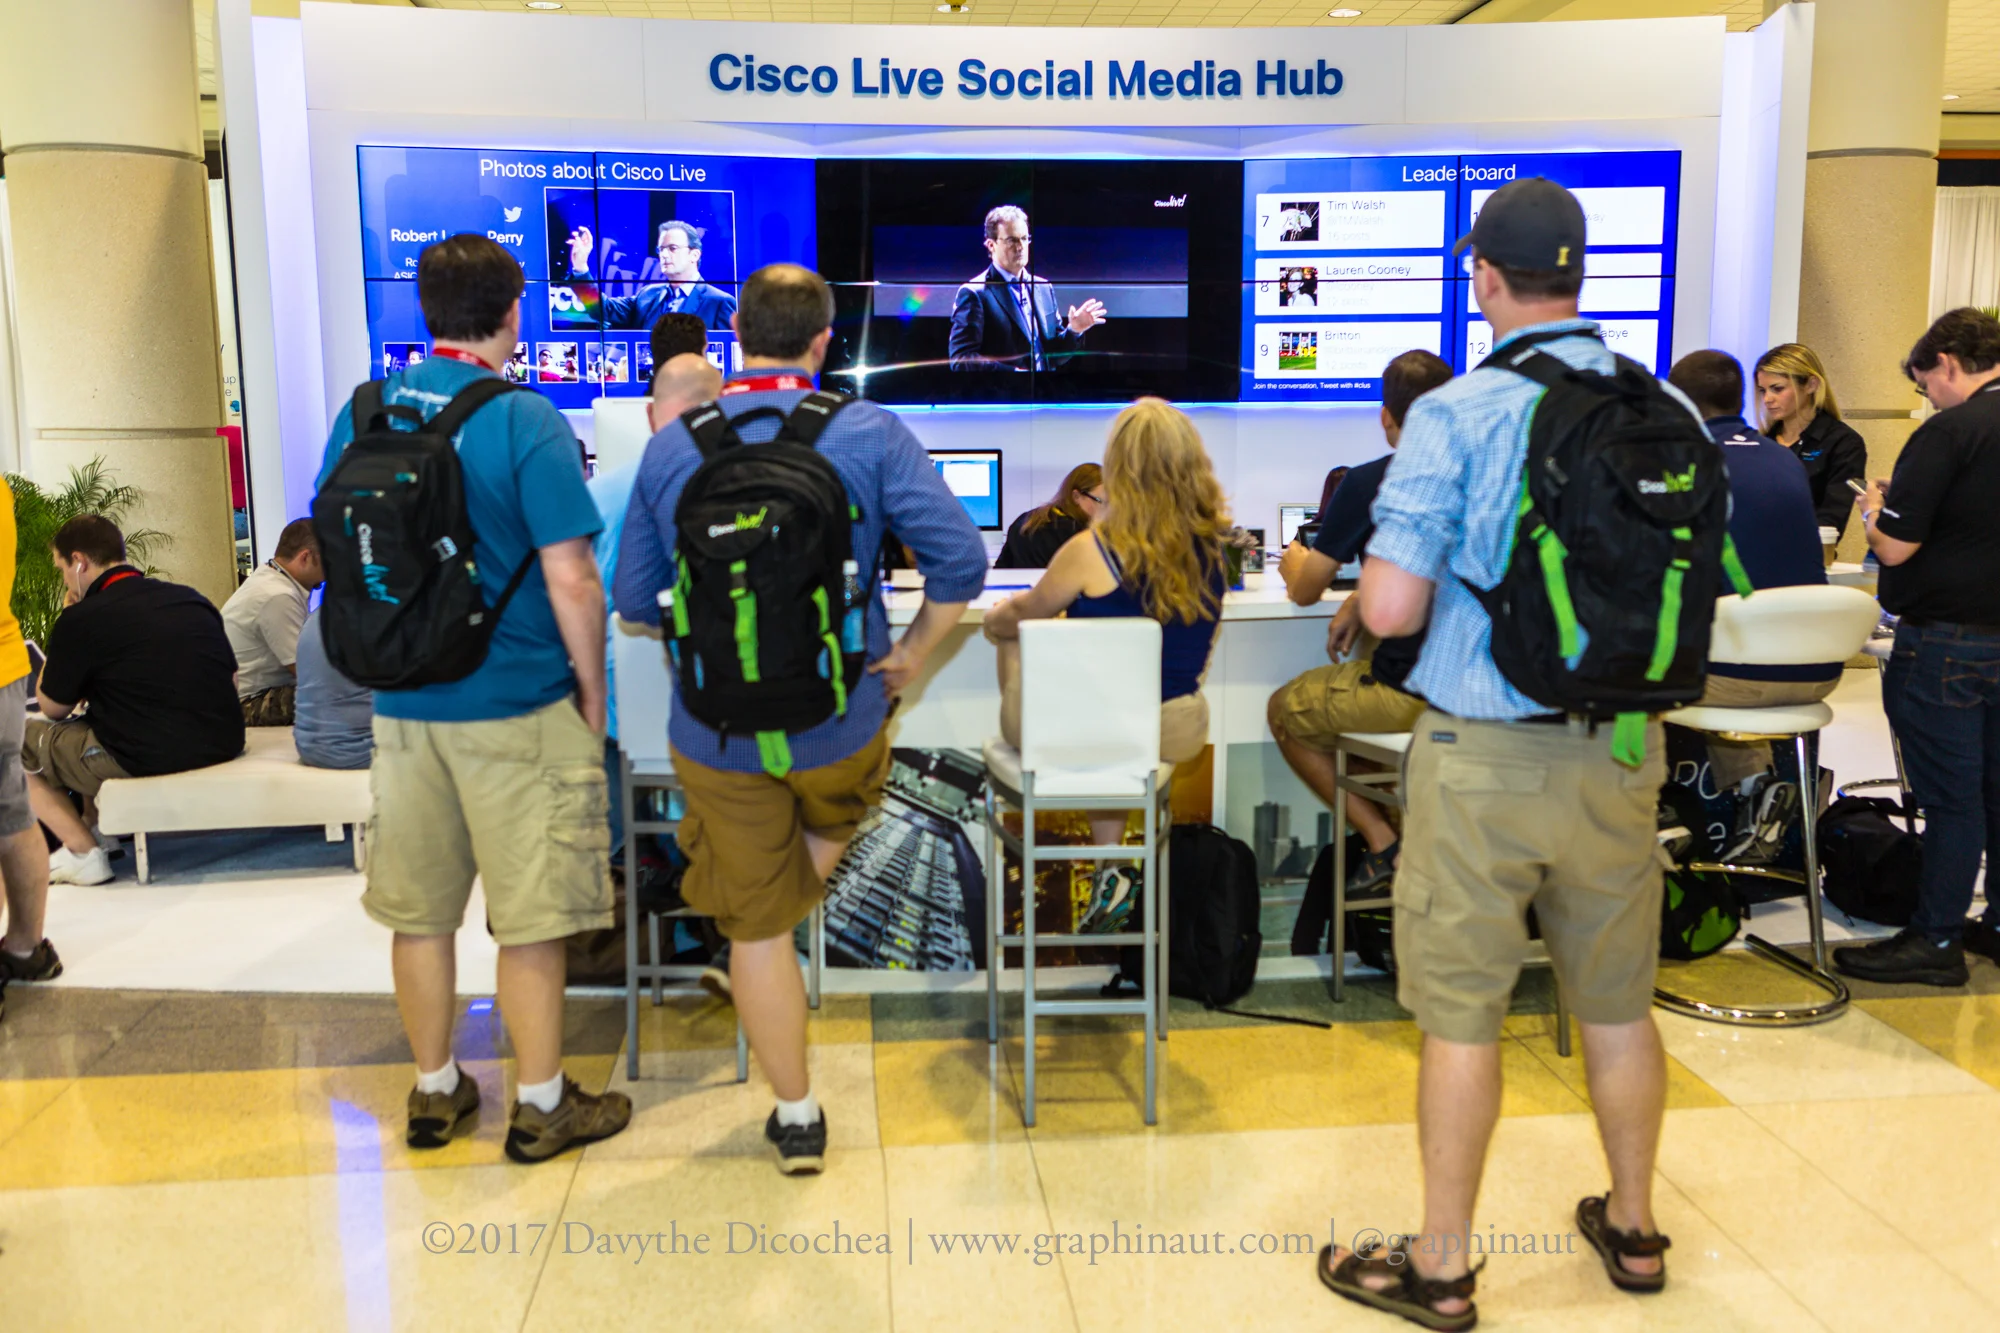
The objective of this project was to create live social media data visualizations to be used as the center piece of the Cisco Live Social Media Hub. These visualizations were an essential component of the hub. The idea of the the visualizations was to showcase the social media conversations, and photos by attendees at the event. It was also meant to excite and encourage attendees to be part of the social media community built around the event.
Overview
Project Type: Cisco sponsored event
Role: Designer, and project manager
Team: Davythe Dicochea (myself), Dennis Khvostionov (developer)
Time: 2 months
Tools: DGLux, Illustrator, Pen and Paper, Photoshop,
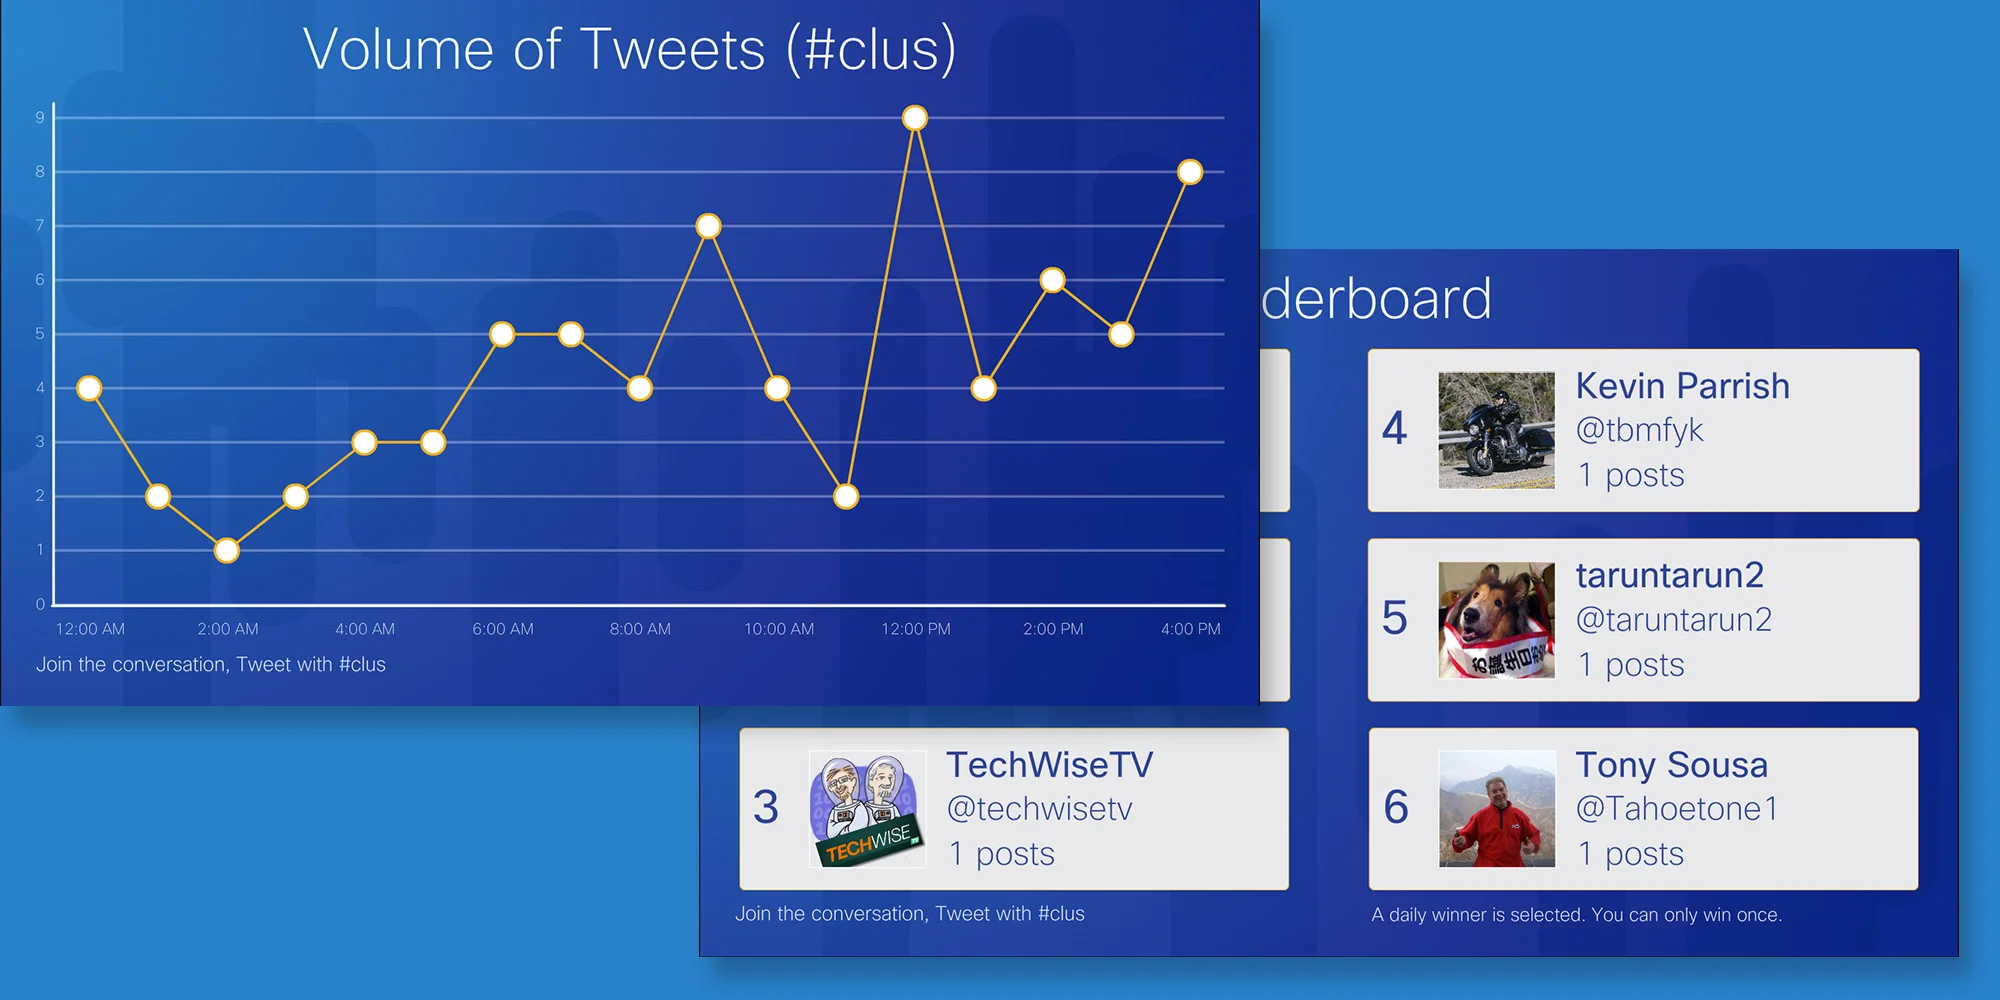
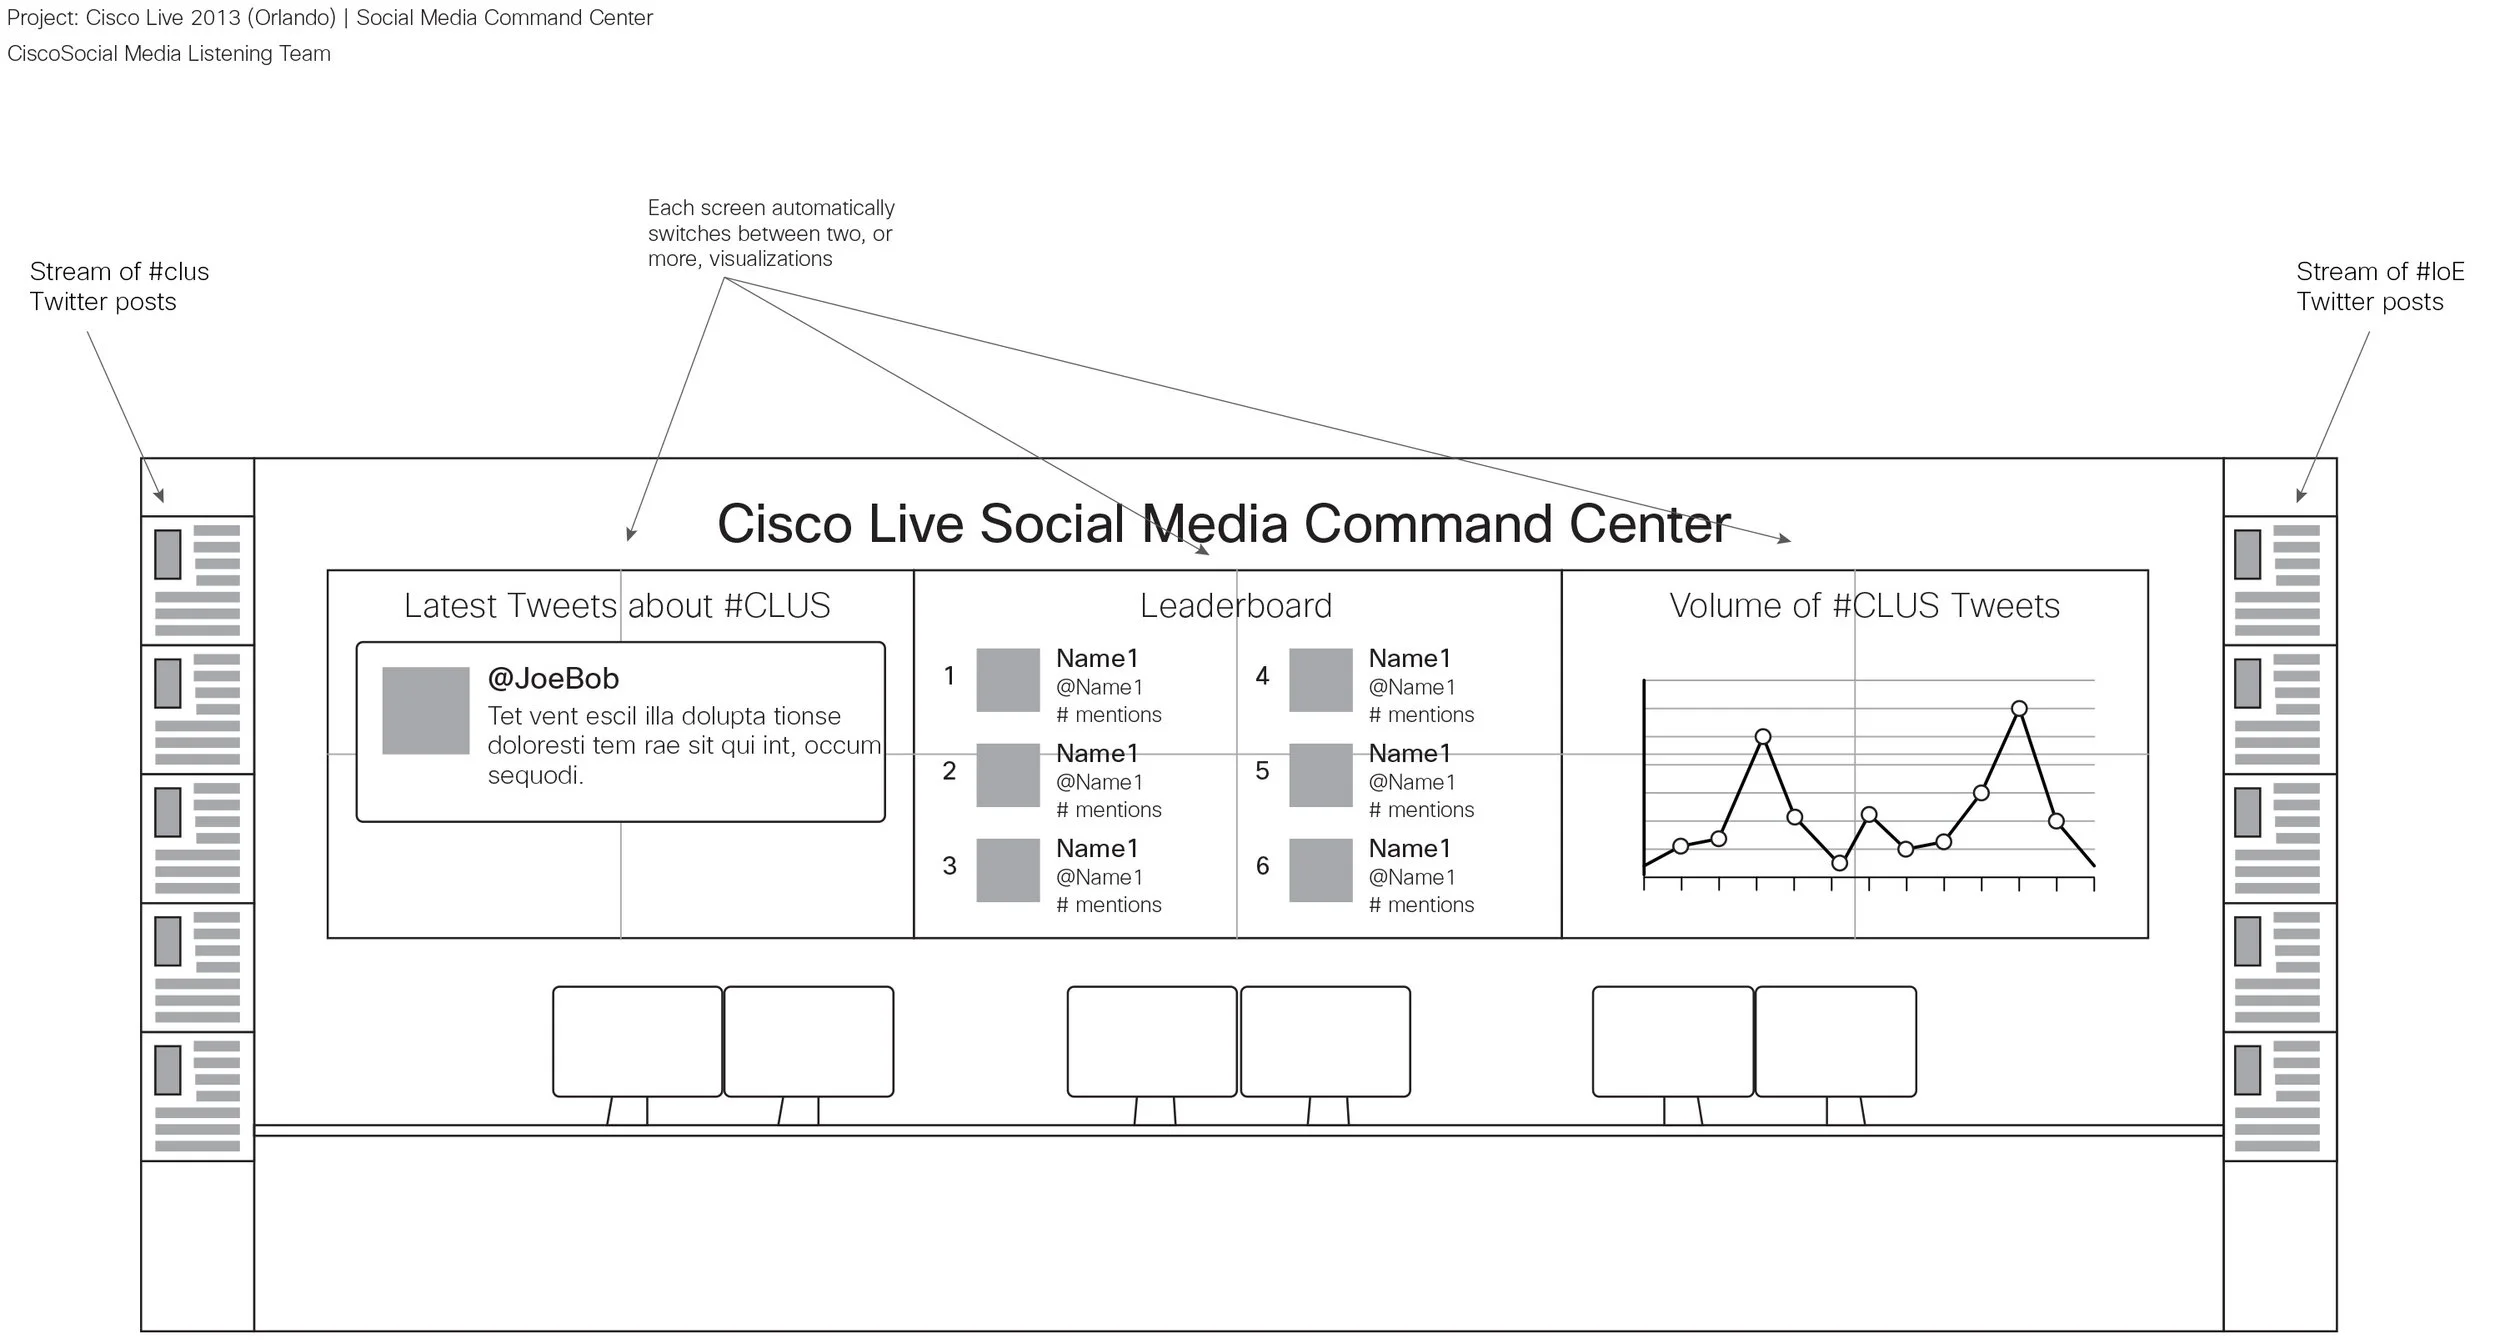
Visualization Requirements
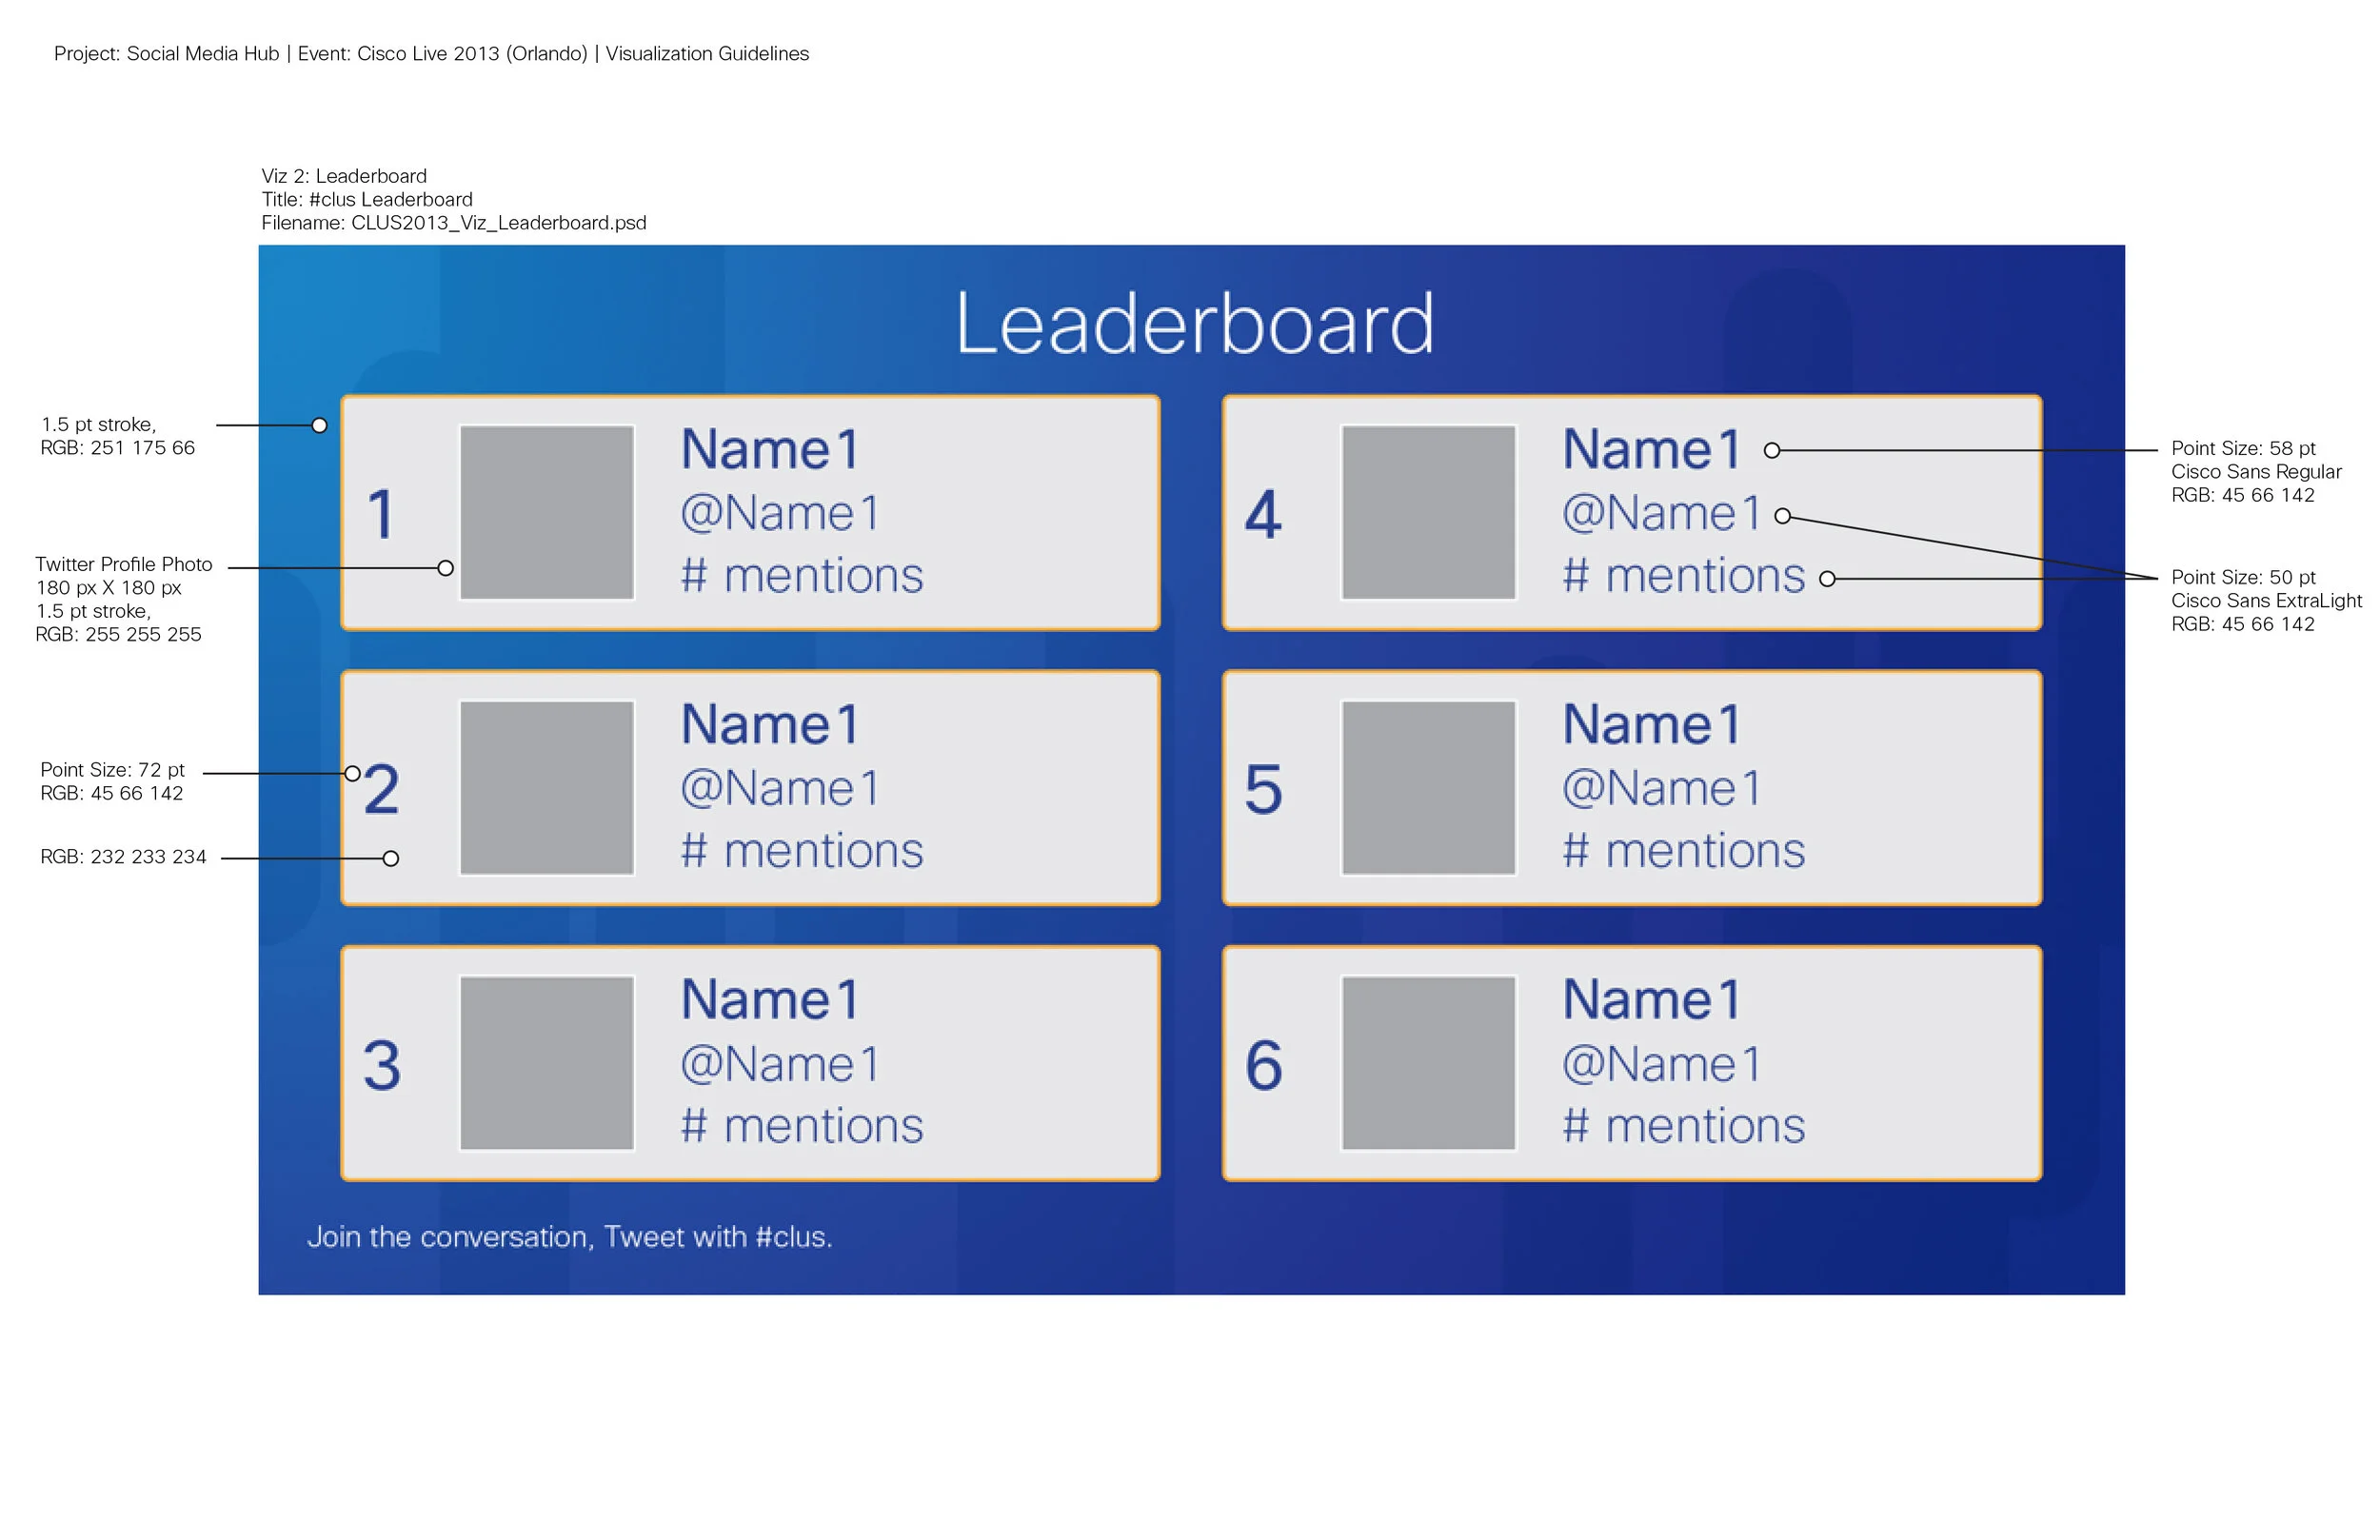
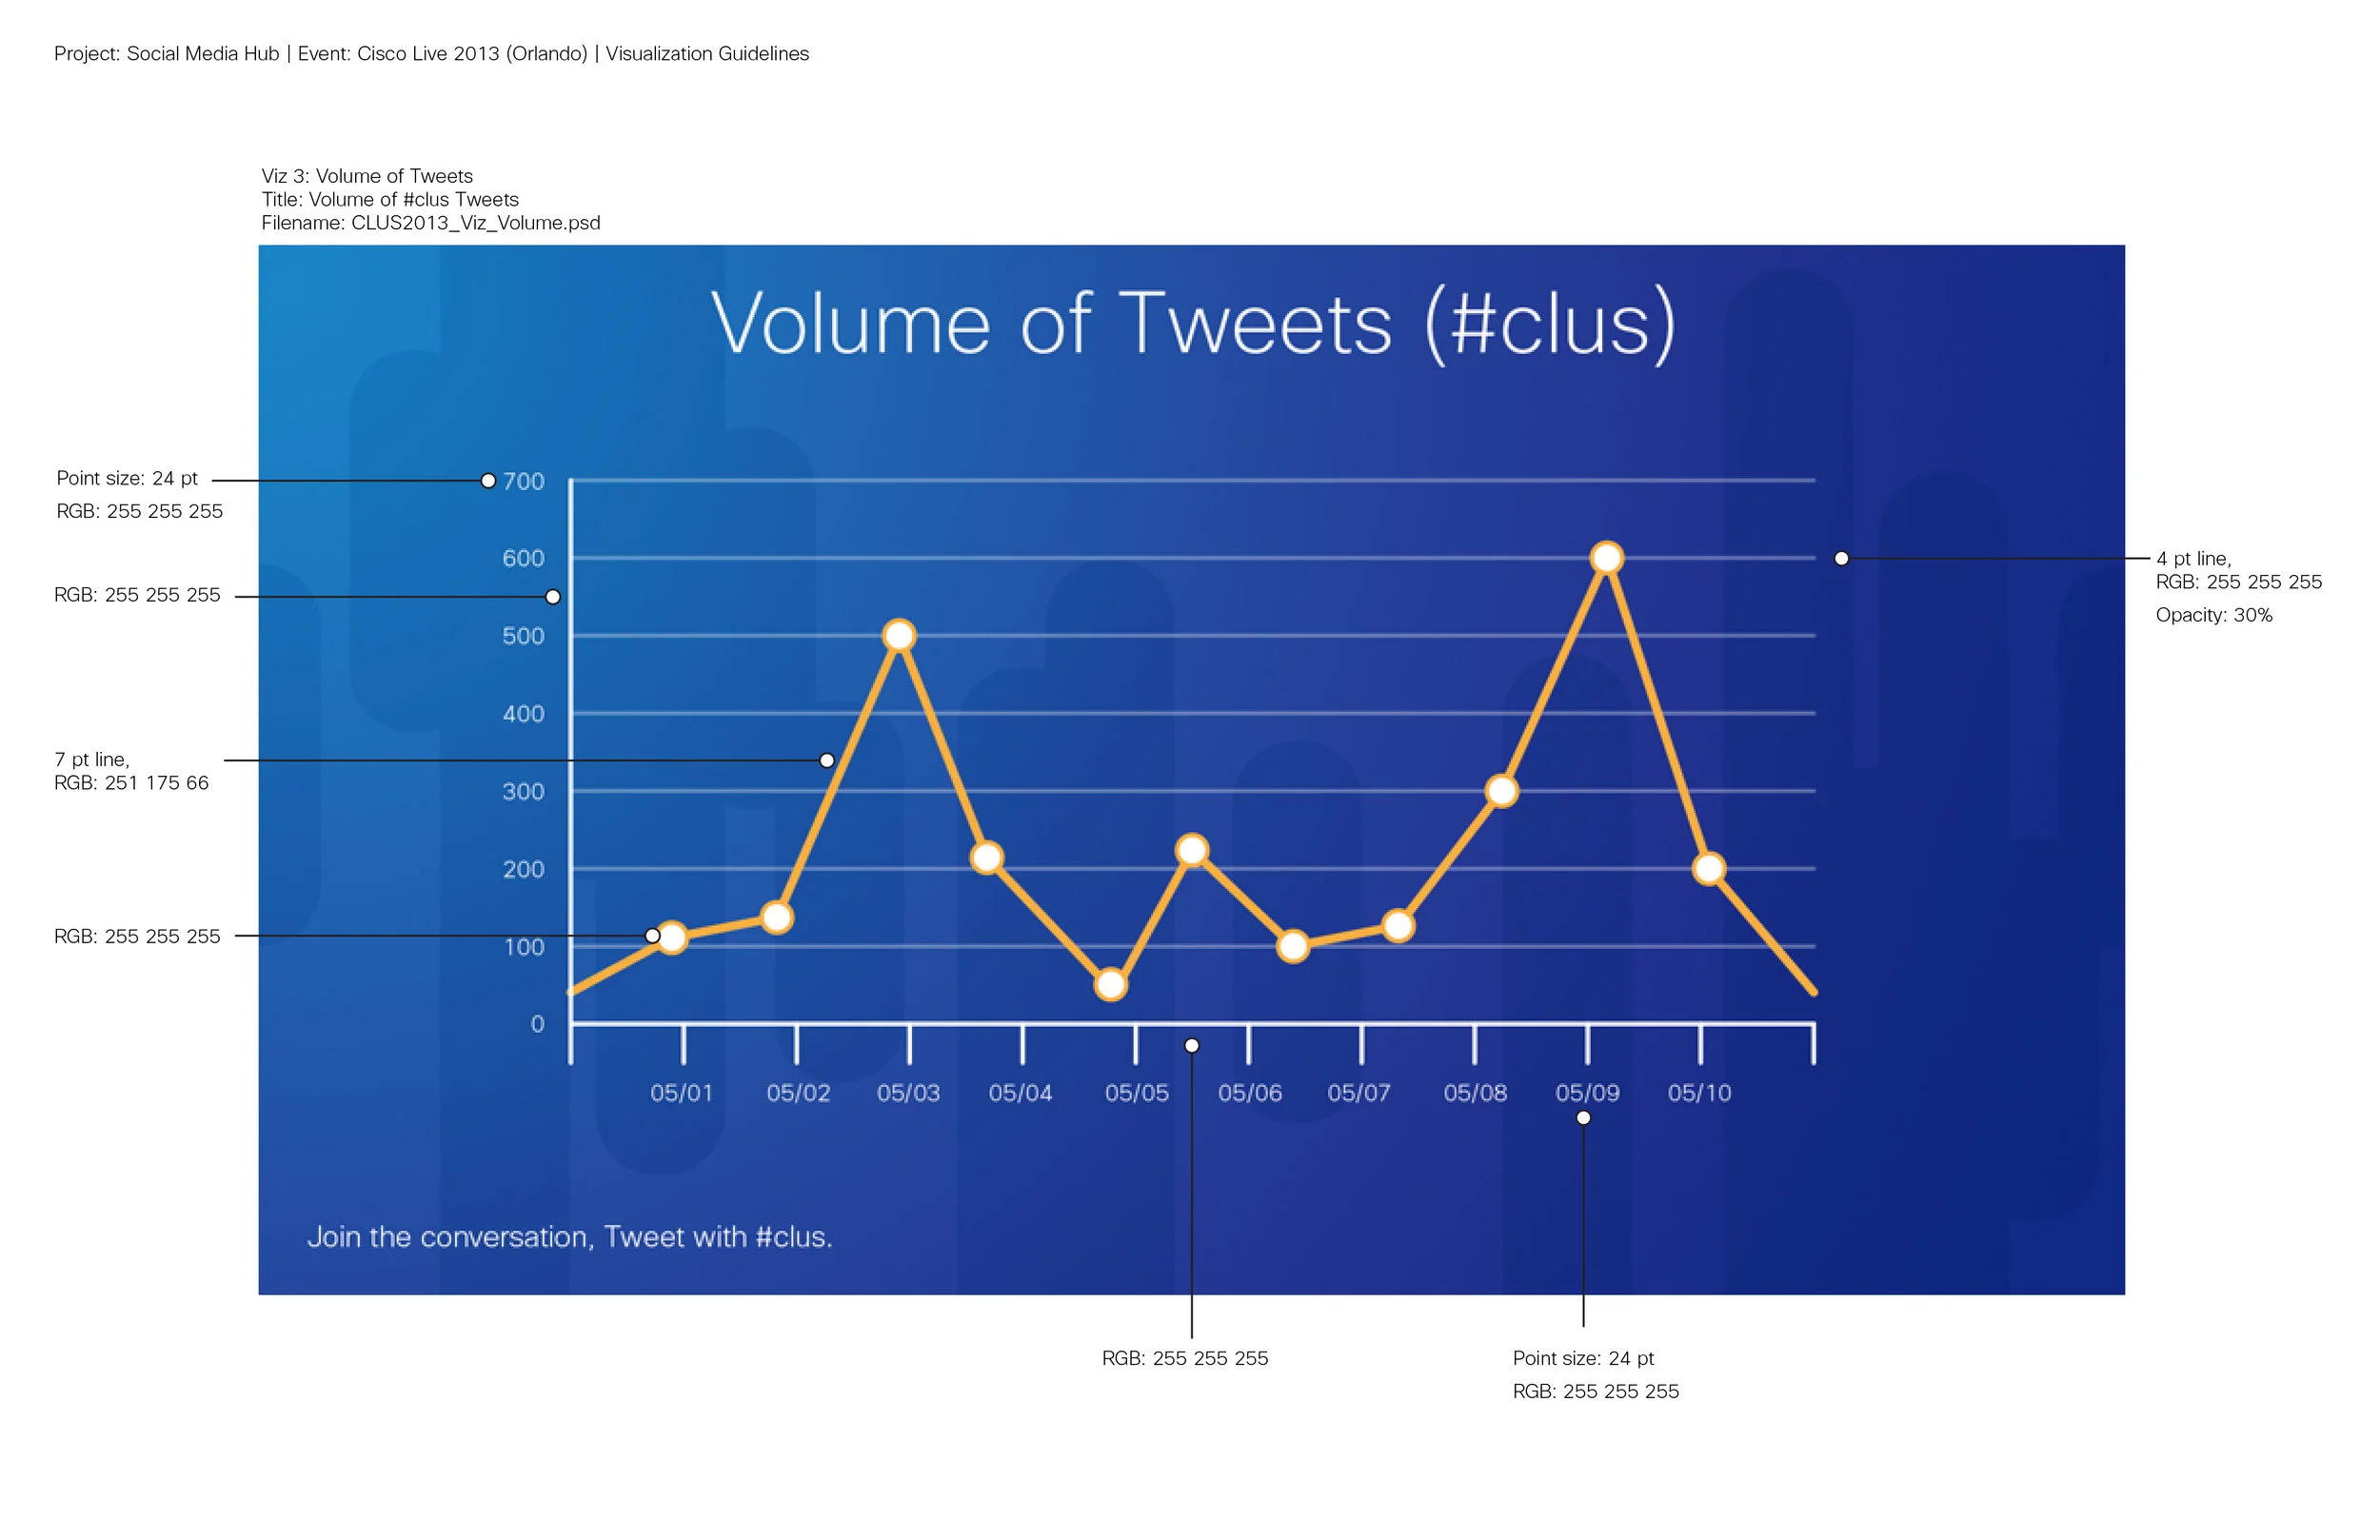
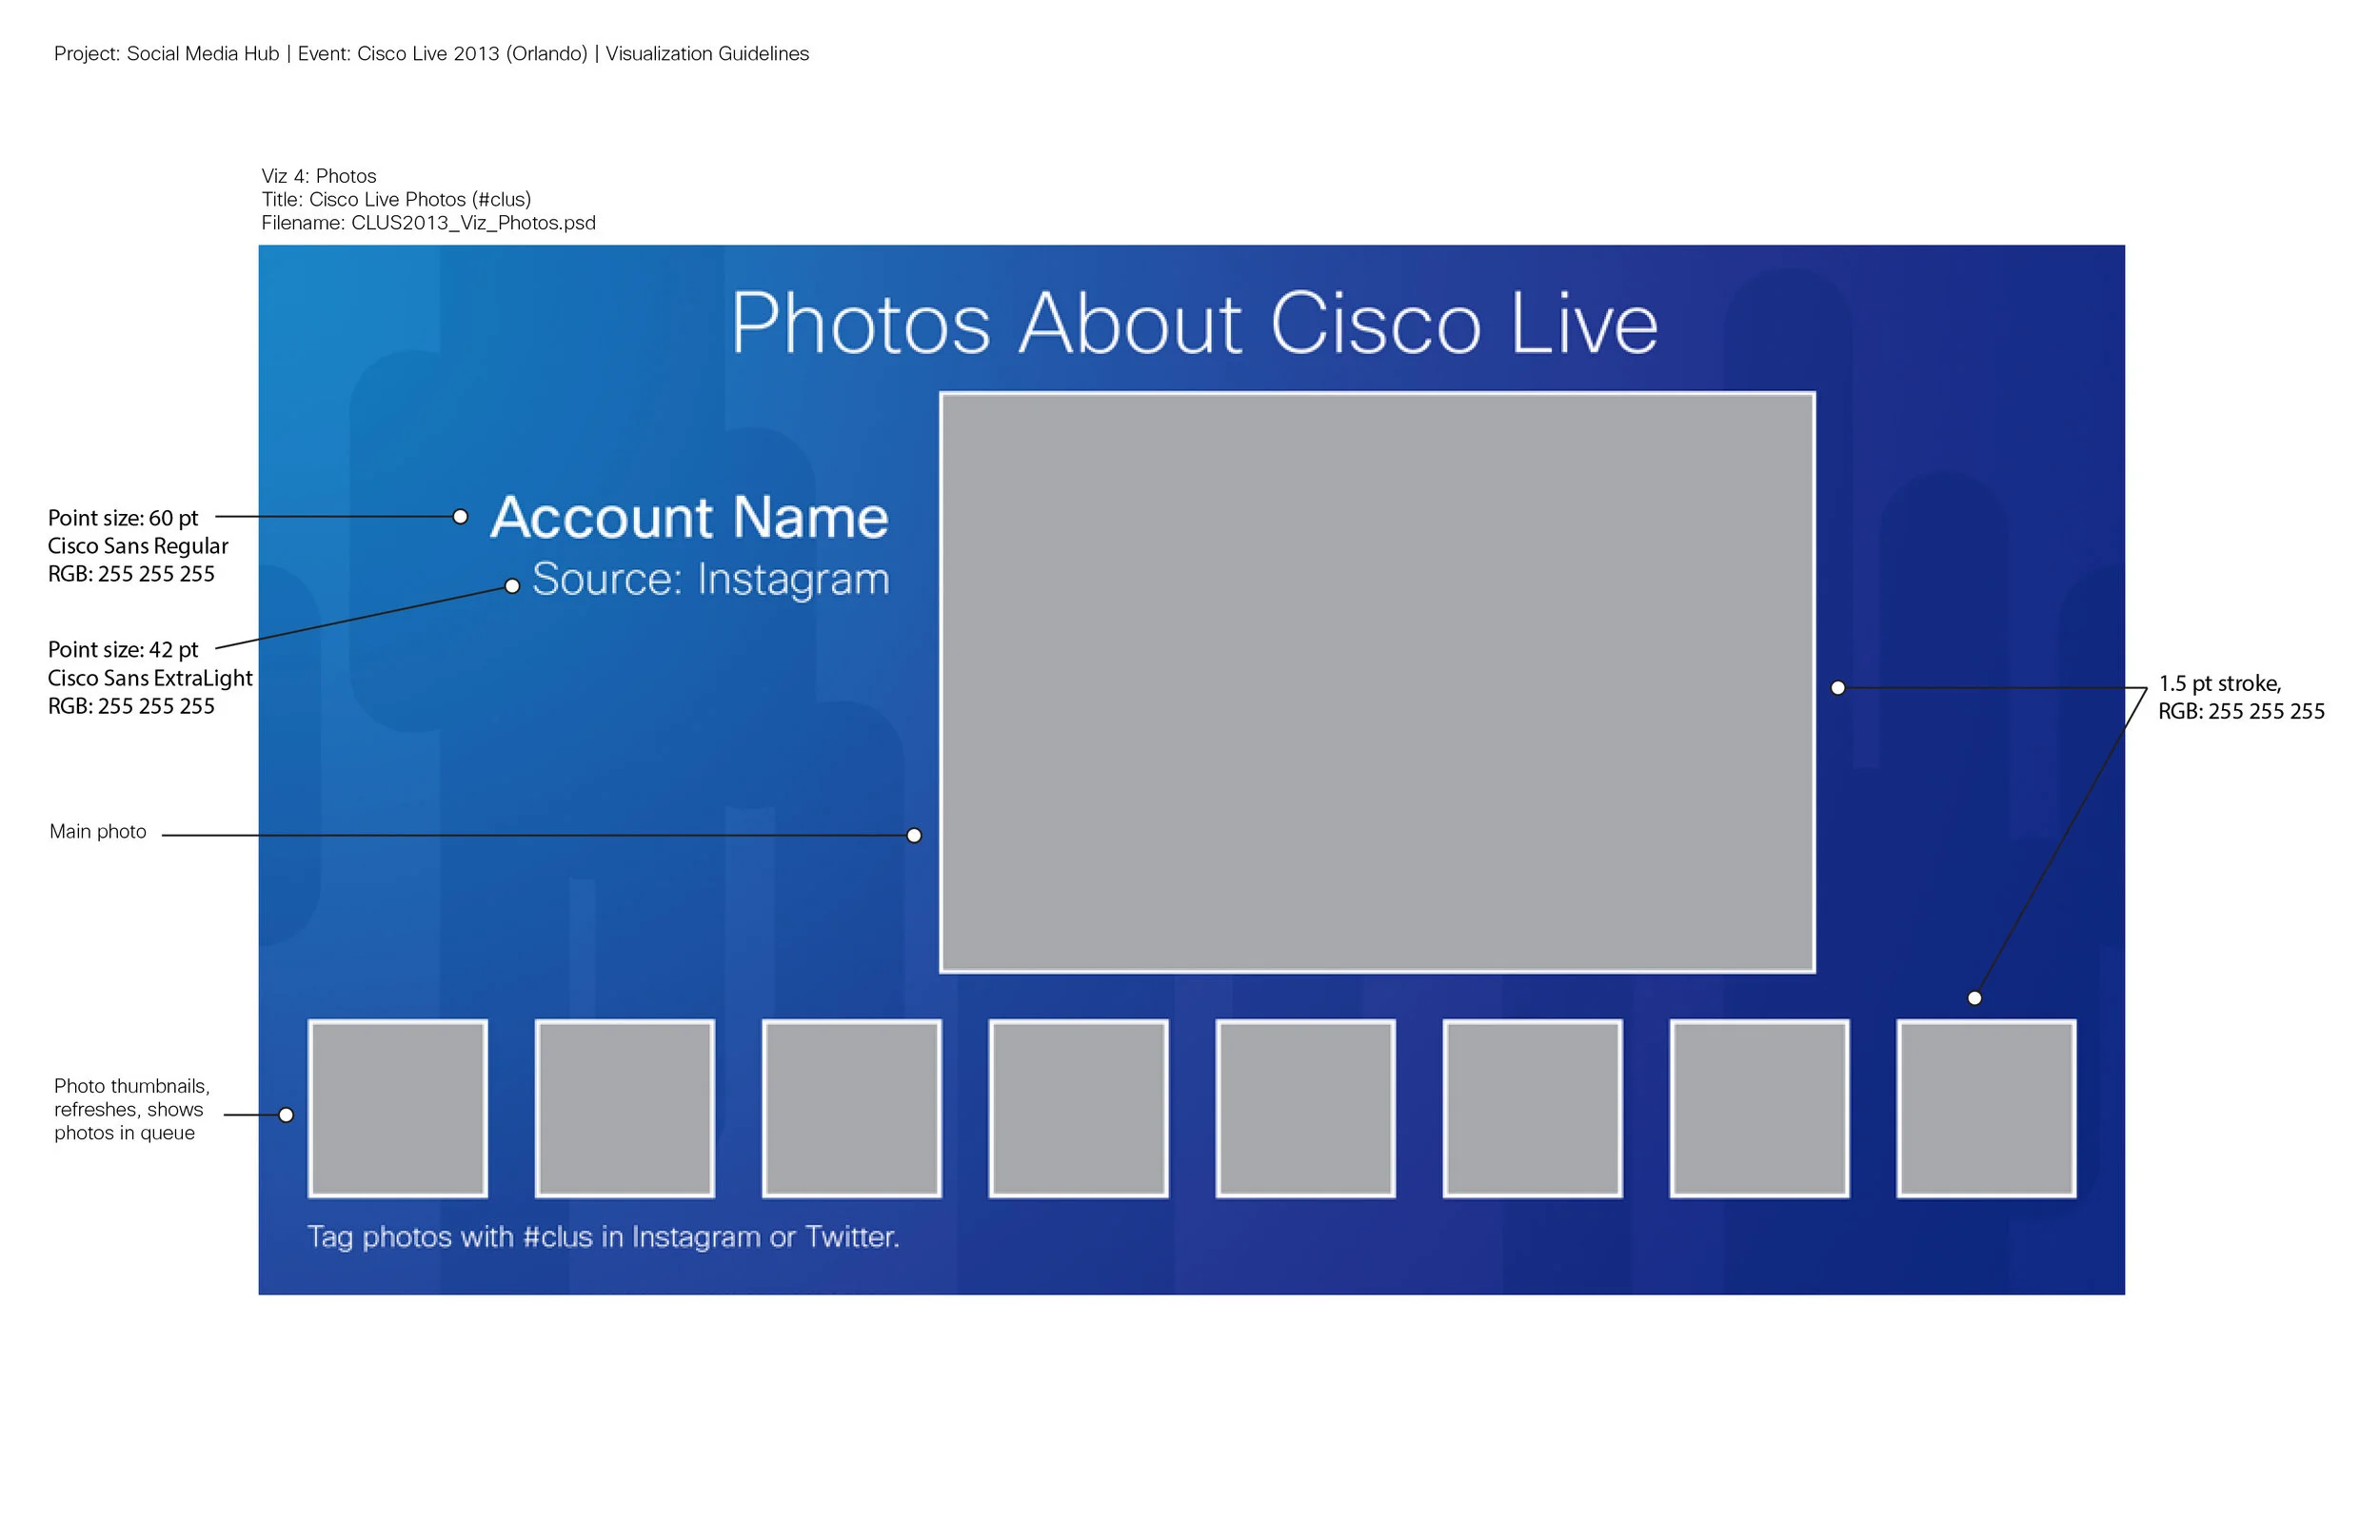
Horizontal visualizations: six to be at the center of the Social Media Hub
(1) leaderboard
(1) photos
(1) volume of tweets
(1) trending topics
(1) highlighted tweets
(1) show floor map
Vertical Visualizations: one to be at each end of the Social Media Hub
(4) Twitter streams, two columns of 2
Hashtags: #ciscolive, #clus, ioe
Data feeds: Twitter, Instagram
Social Media Hub Layout
The physical structure of the hub was already designed. The size and placement of the monitors was preconfigured. This was the framework I had to work with. As a start, I requested the CAD drawings of the hub to then reconstruct this clean accurate view of the hub.
Social Media Hub Elevation
Initial Wireframes and Proposed Visualization Layout
As a team, we decided what kinds of content we wanted to share on the monitors. I then created early concepts, and went through several revision cycles. Revisions included brand compliance, naming, color combinations, and other details. What I'm sharing below are the final visualization wireframes in black and white placed in the hub wireframe.
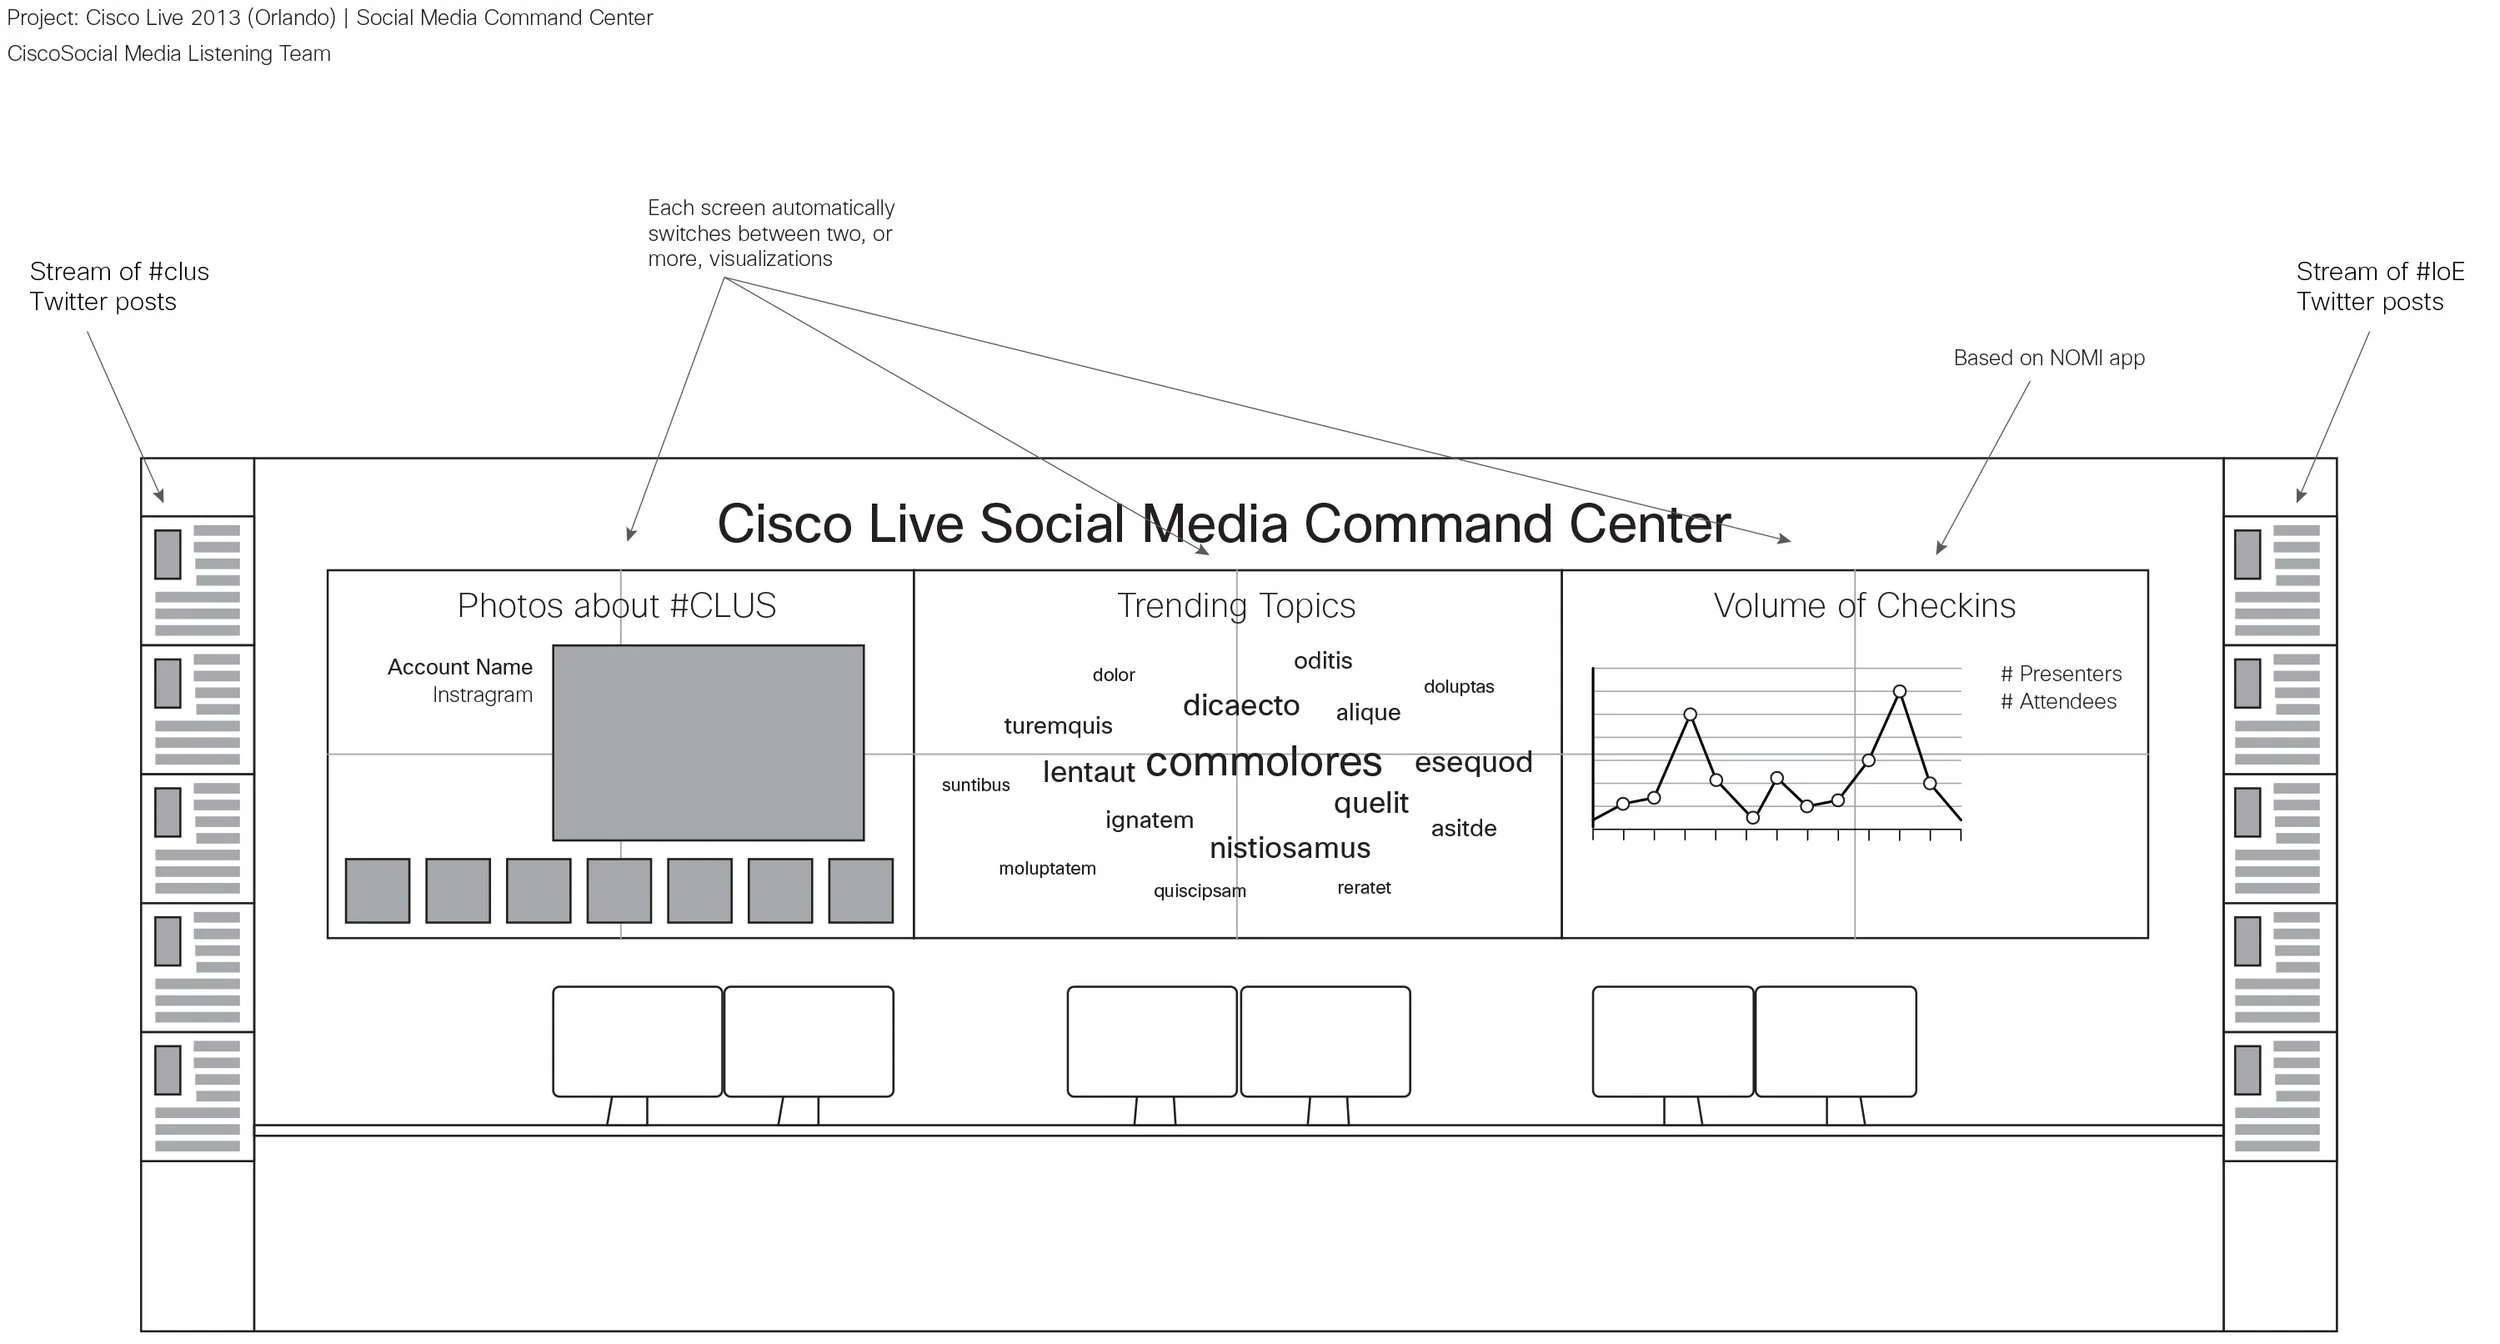

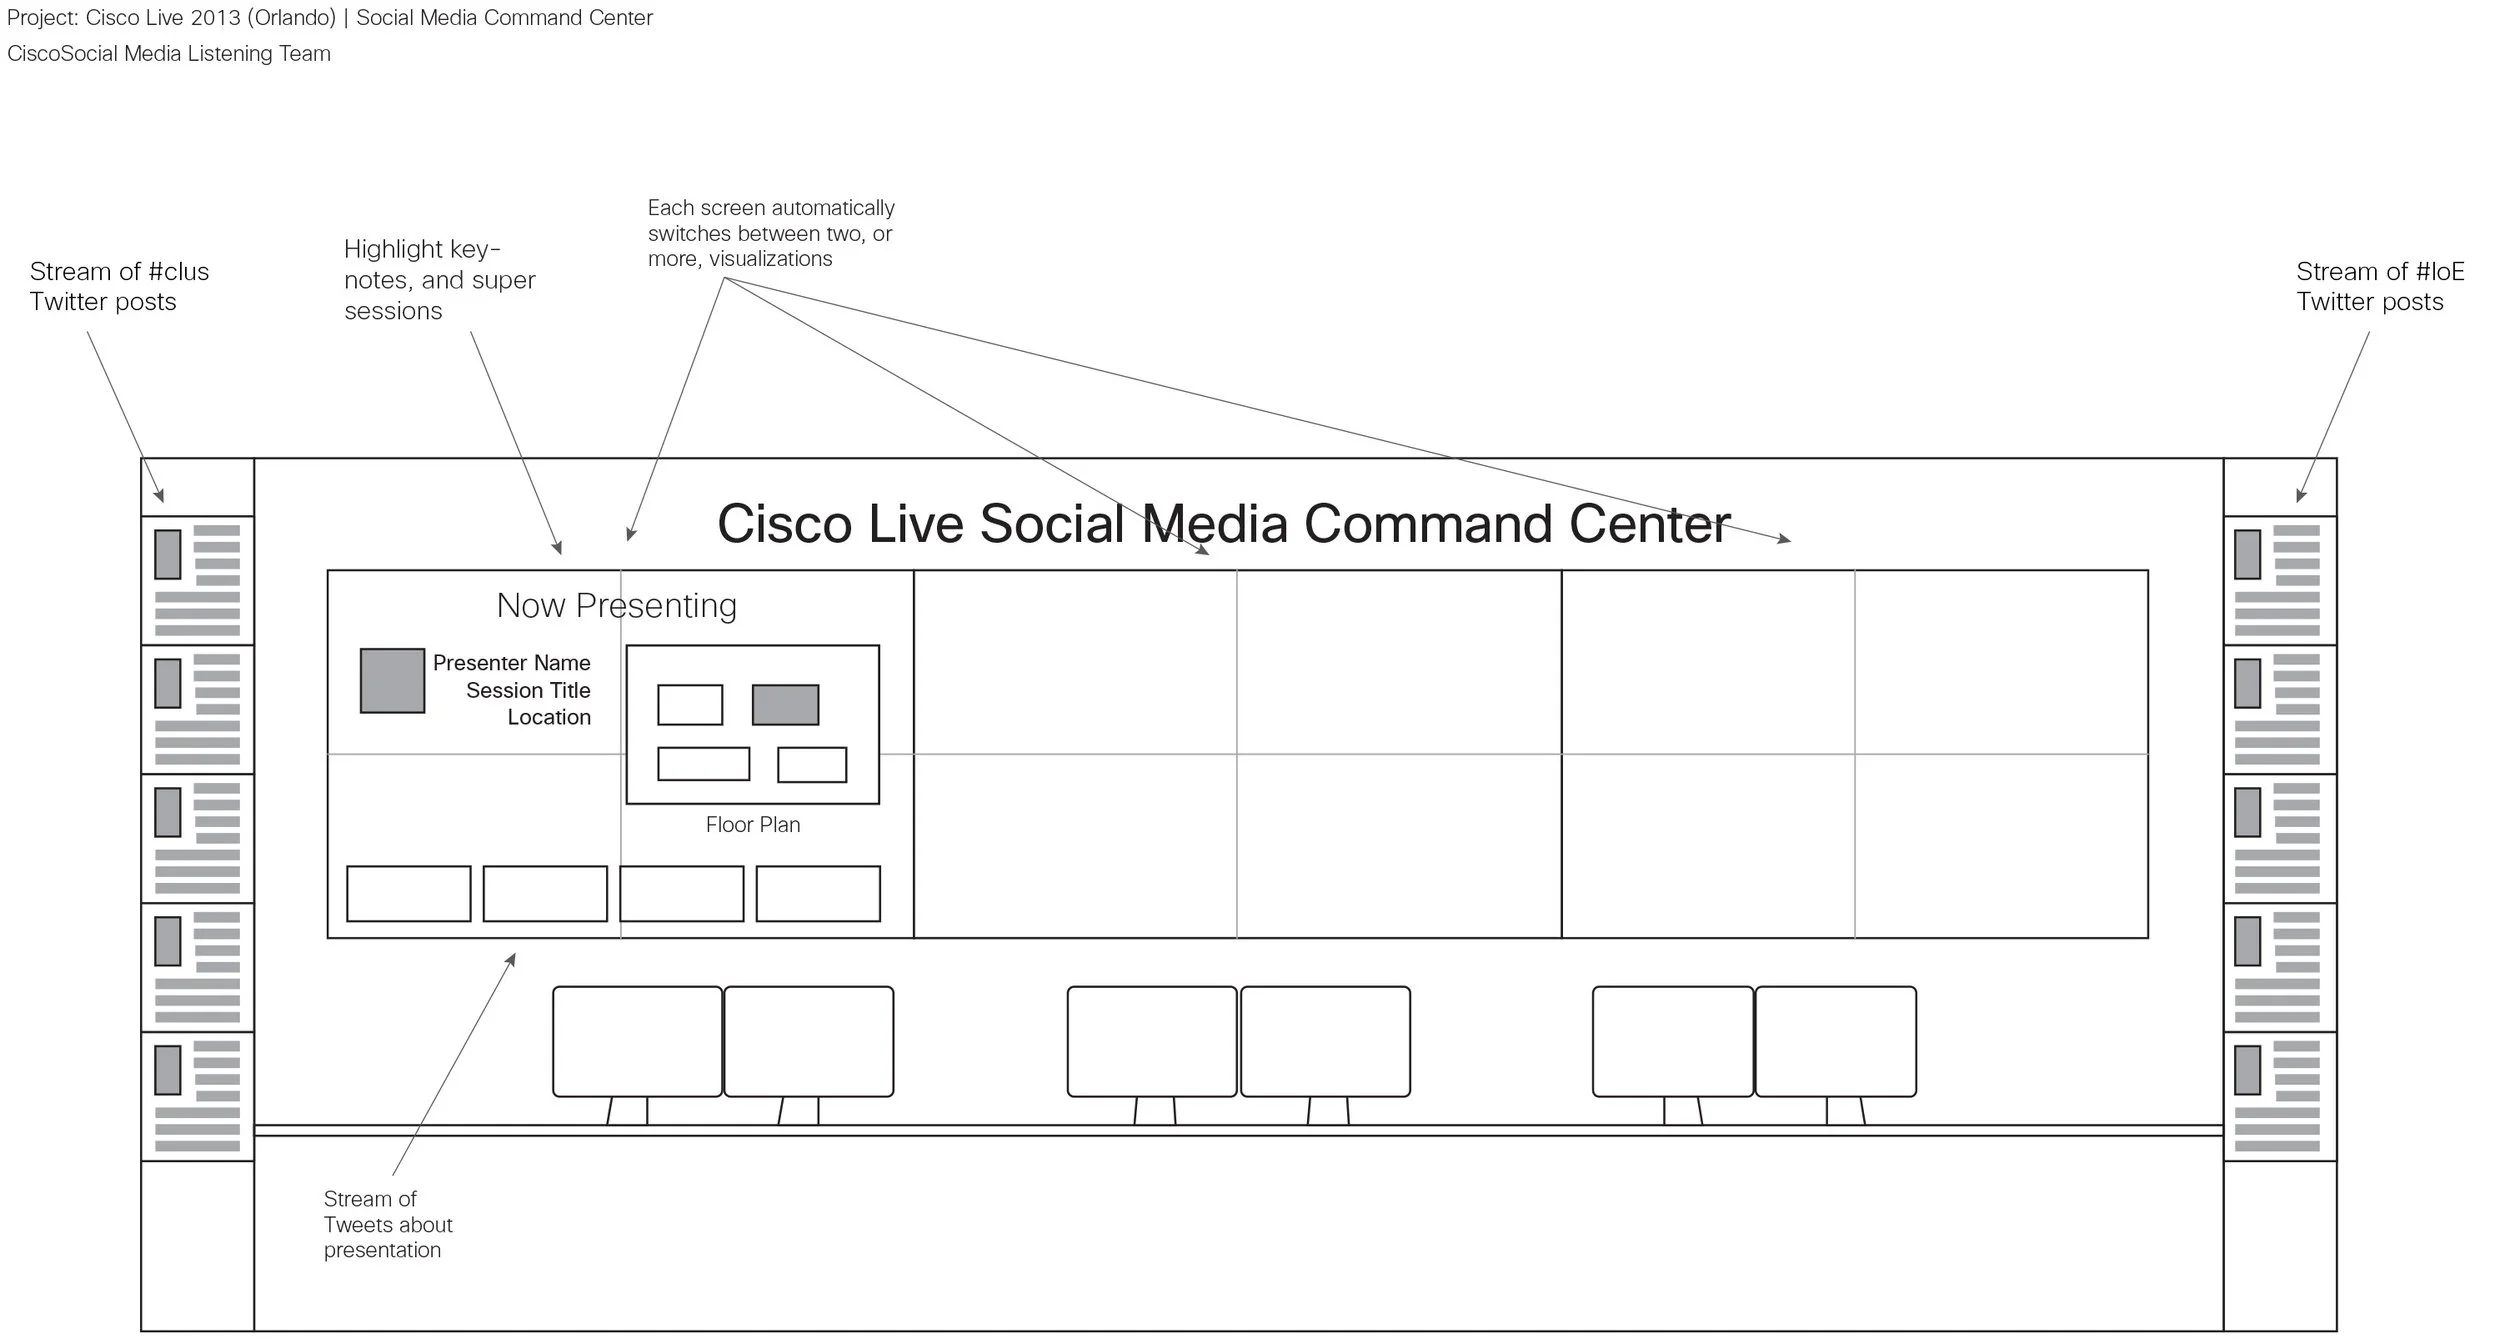
Final Wireframes
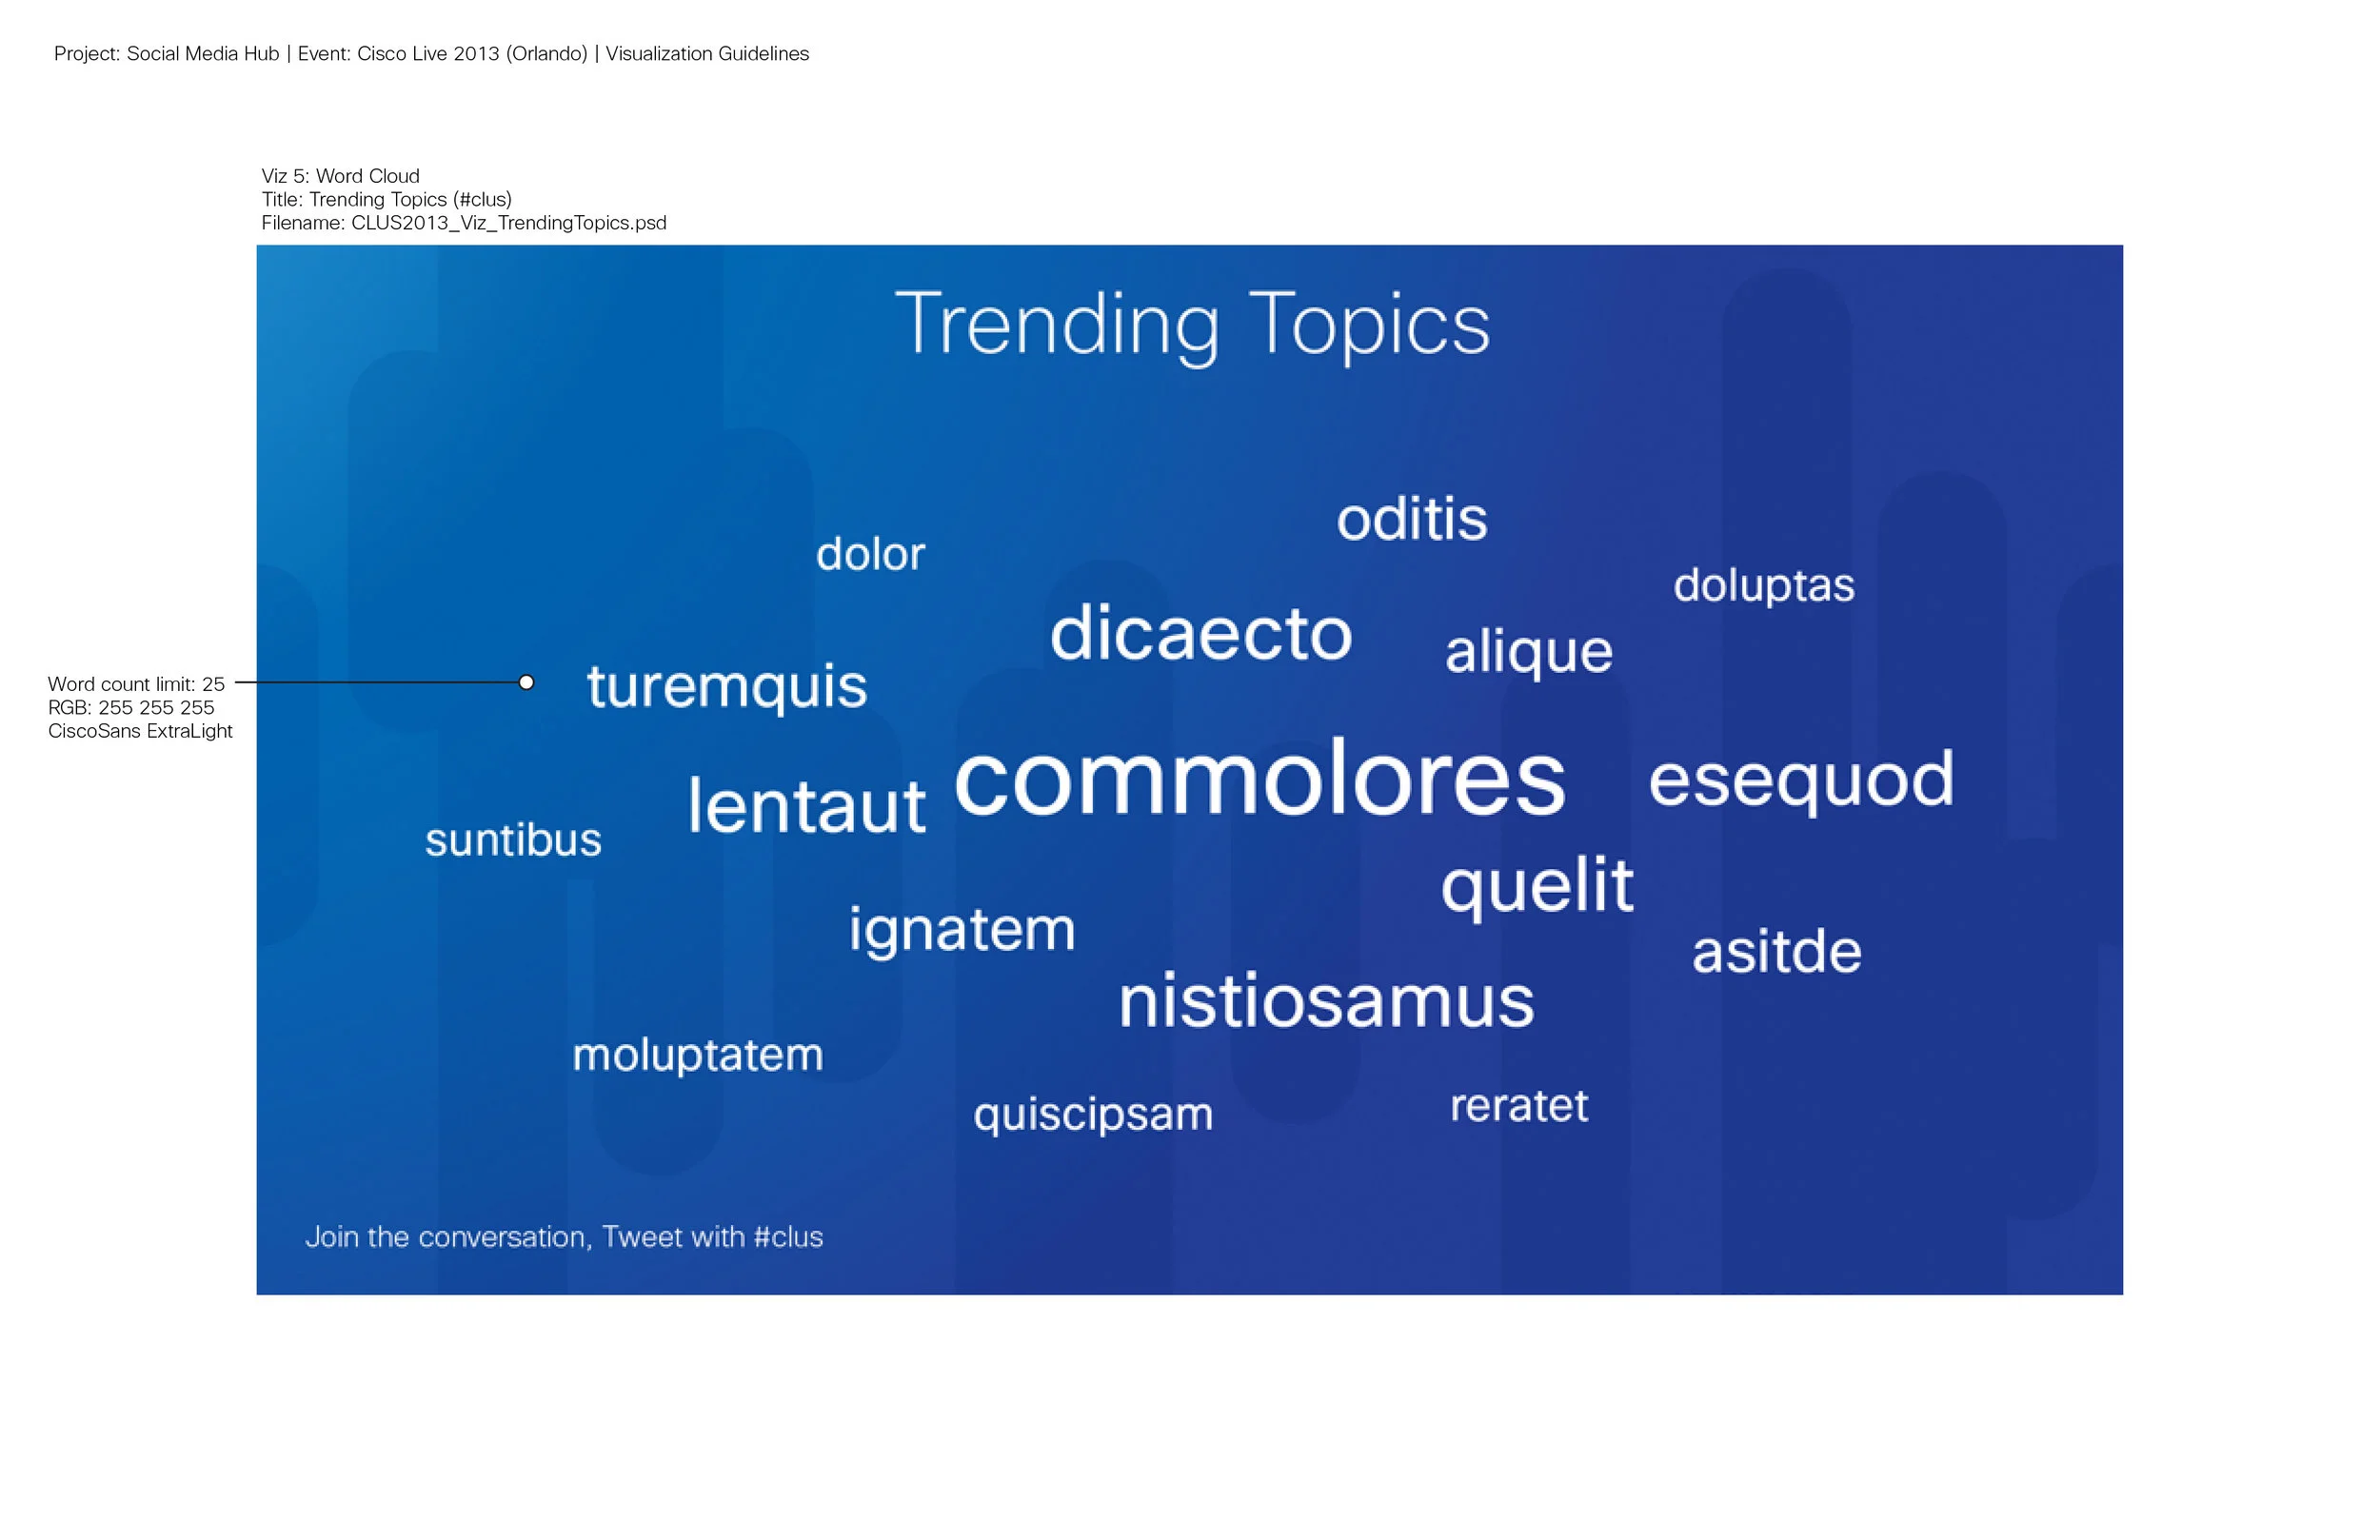
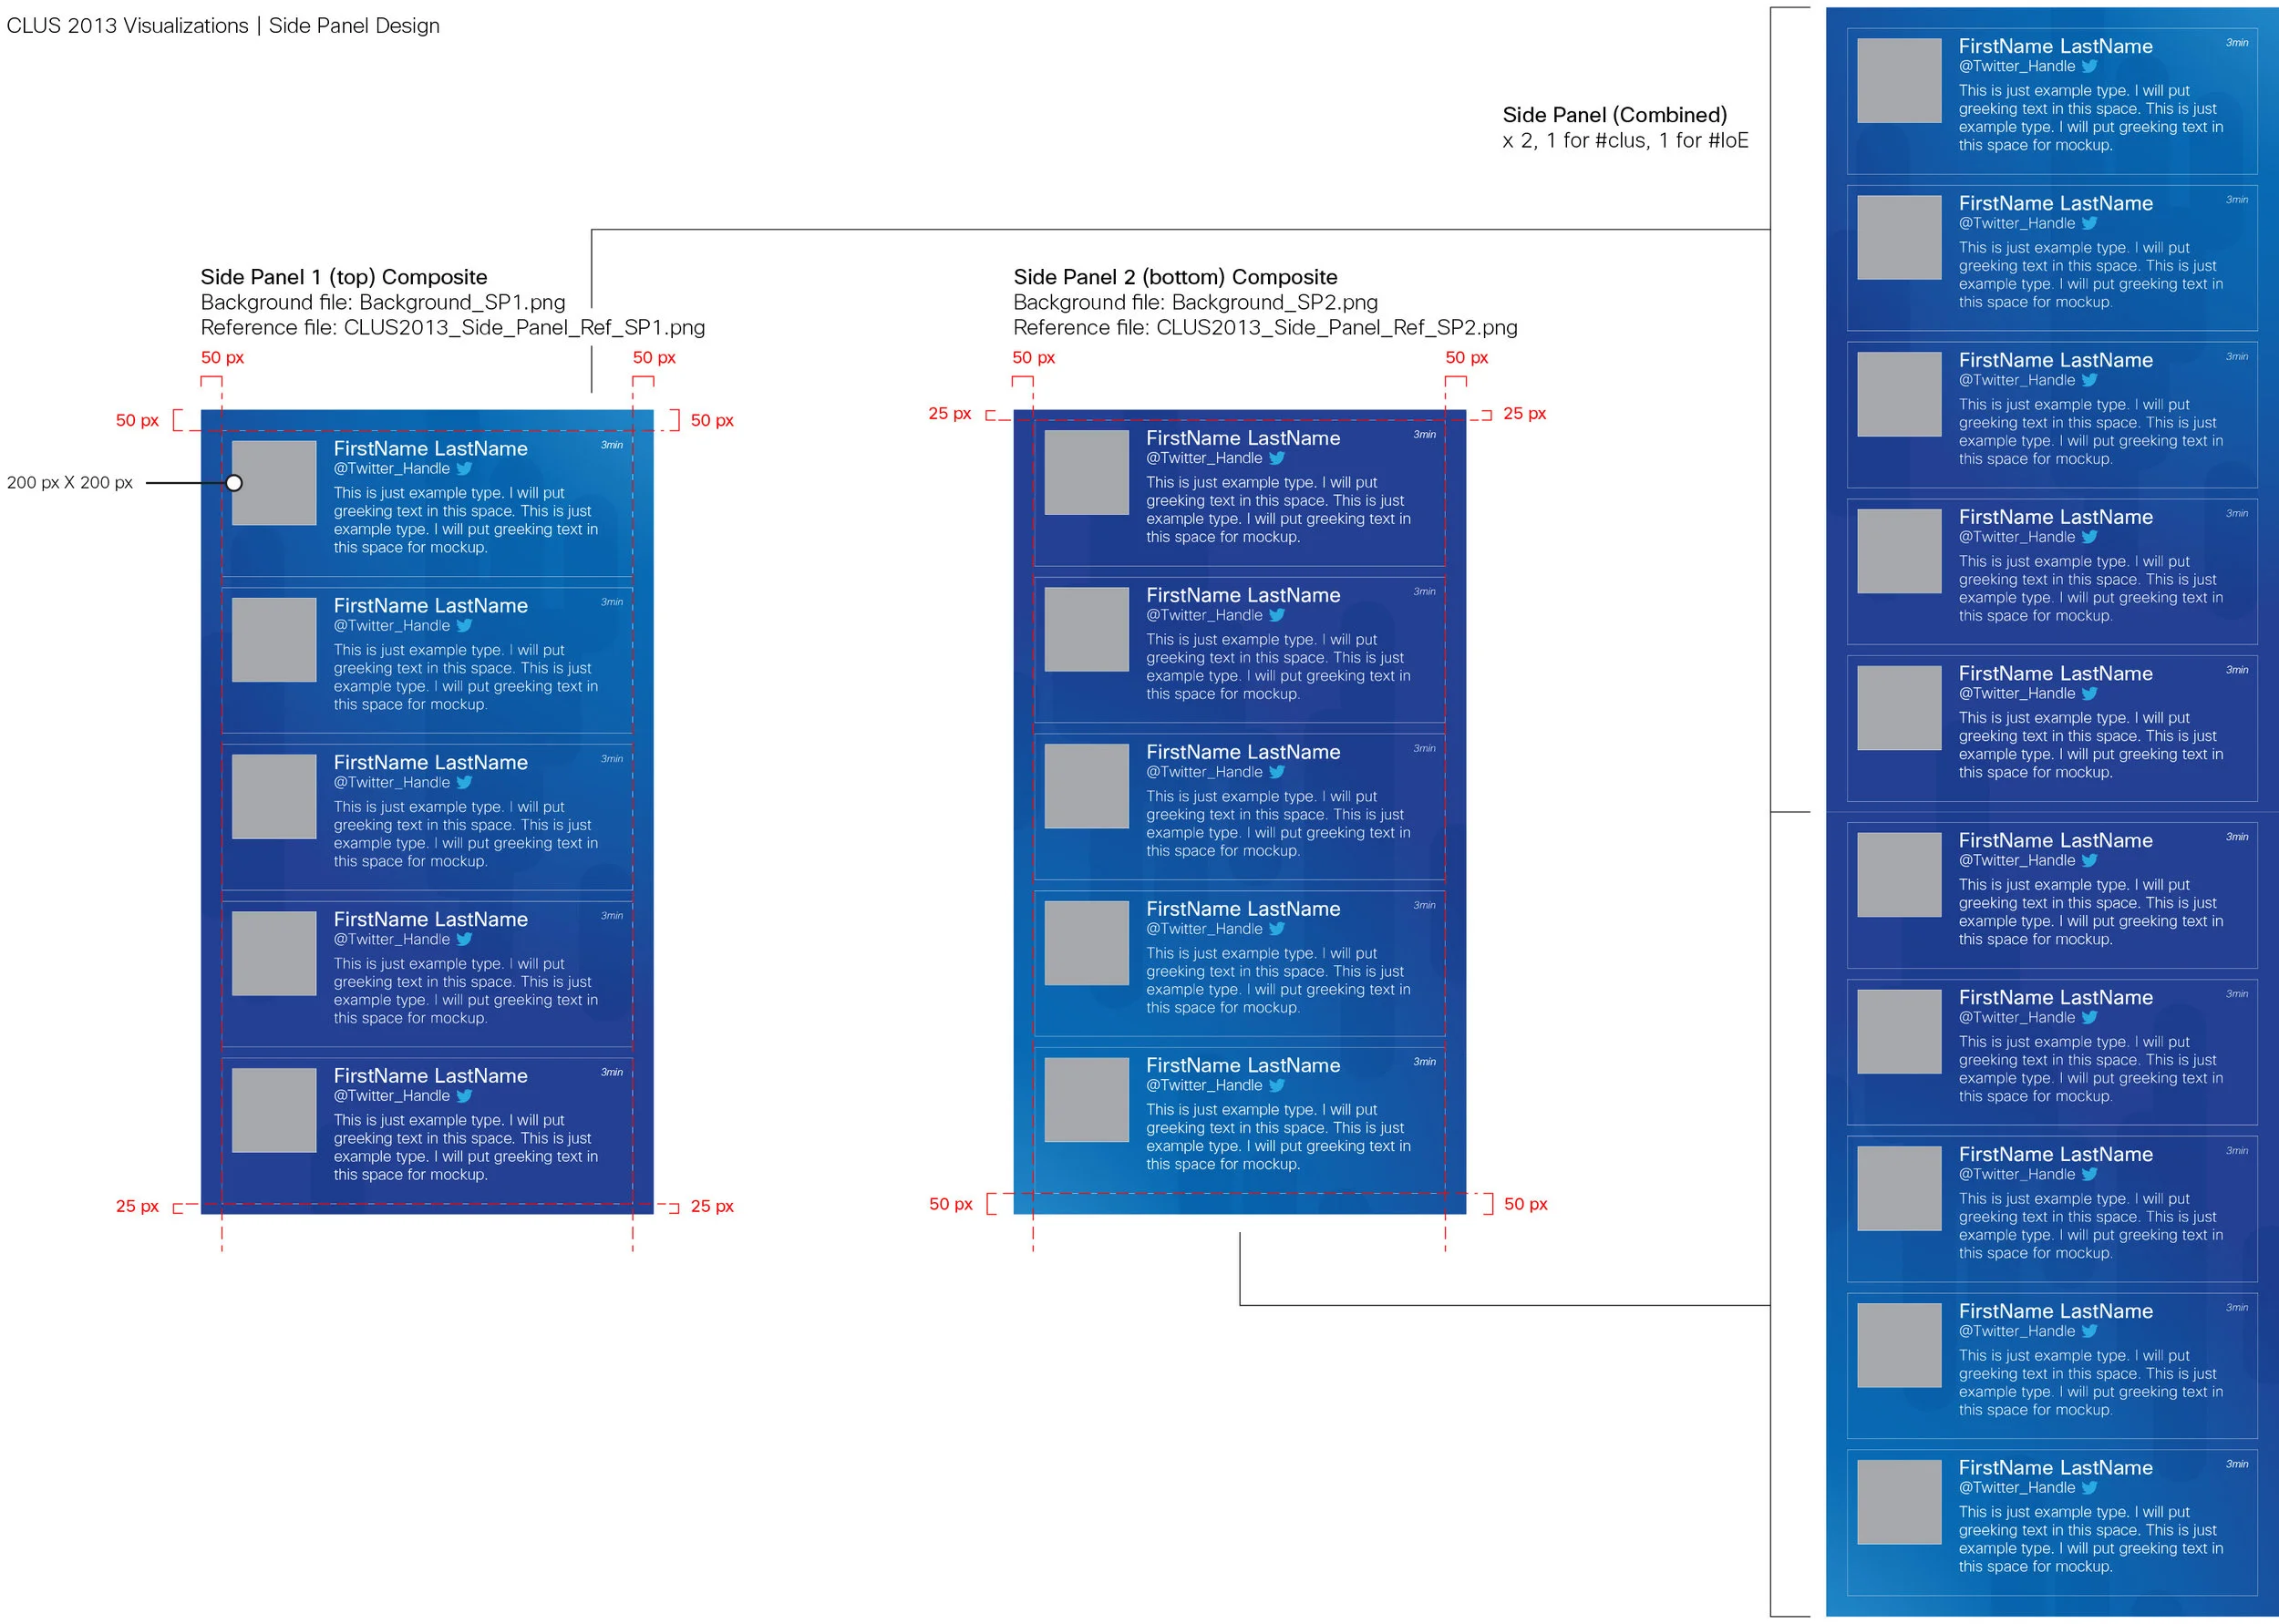
I designed these wireframes specific to the pixel. The background image was used as is. The details for each different visualization were exactly specified and provided in the form of a set of PSD files. The developer referenced these files, along with the guidelines PDF (see Visualization Guidelines below), to then reproduce the working visualizations.

Final Color Mockup
I created a color mockup and shared with the greater team to give them a sense of what the Social Media Hub will look like.
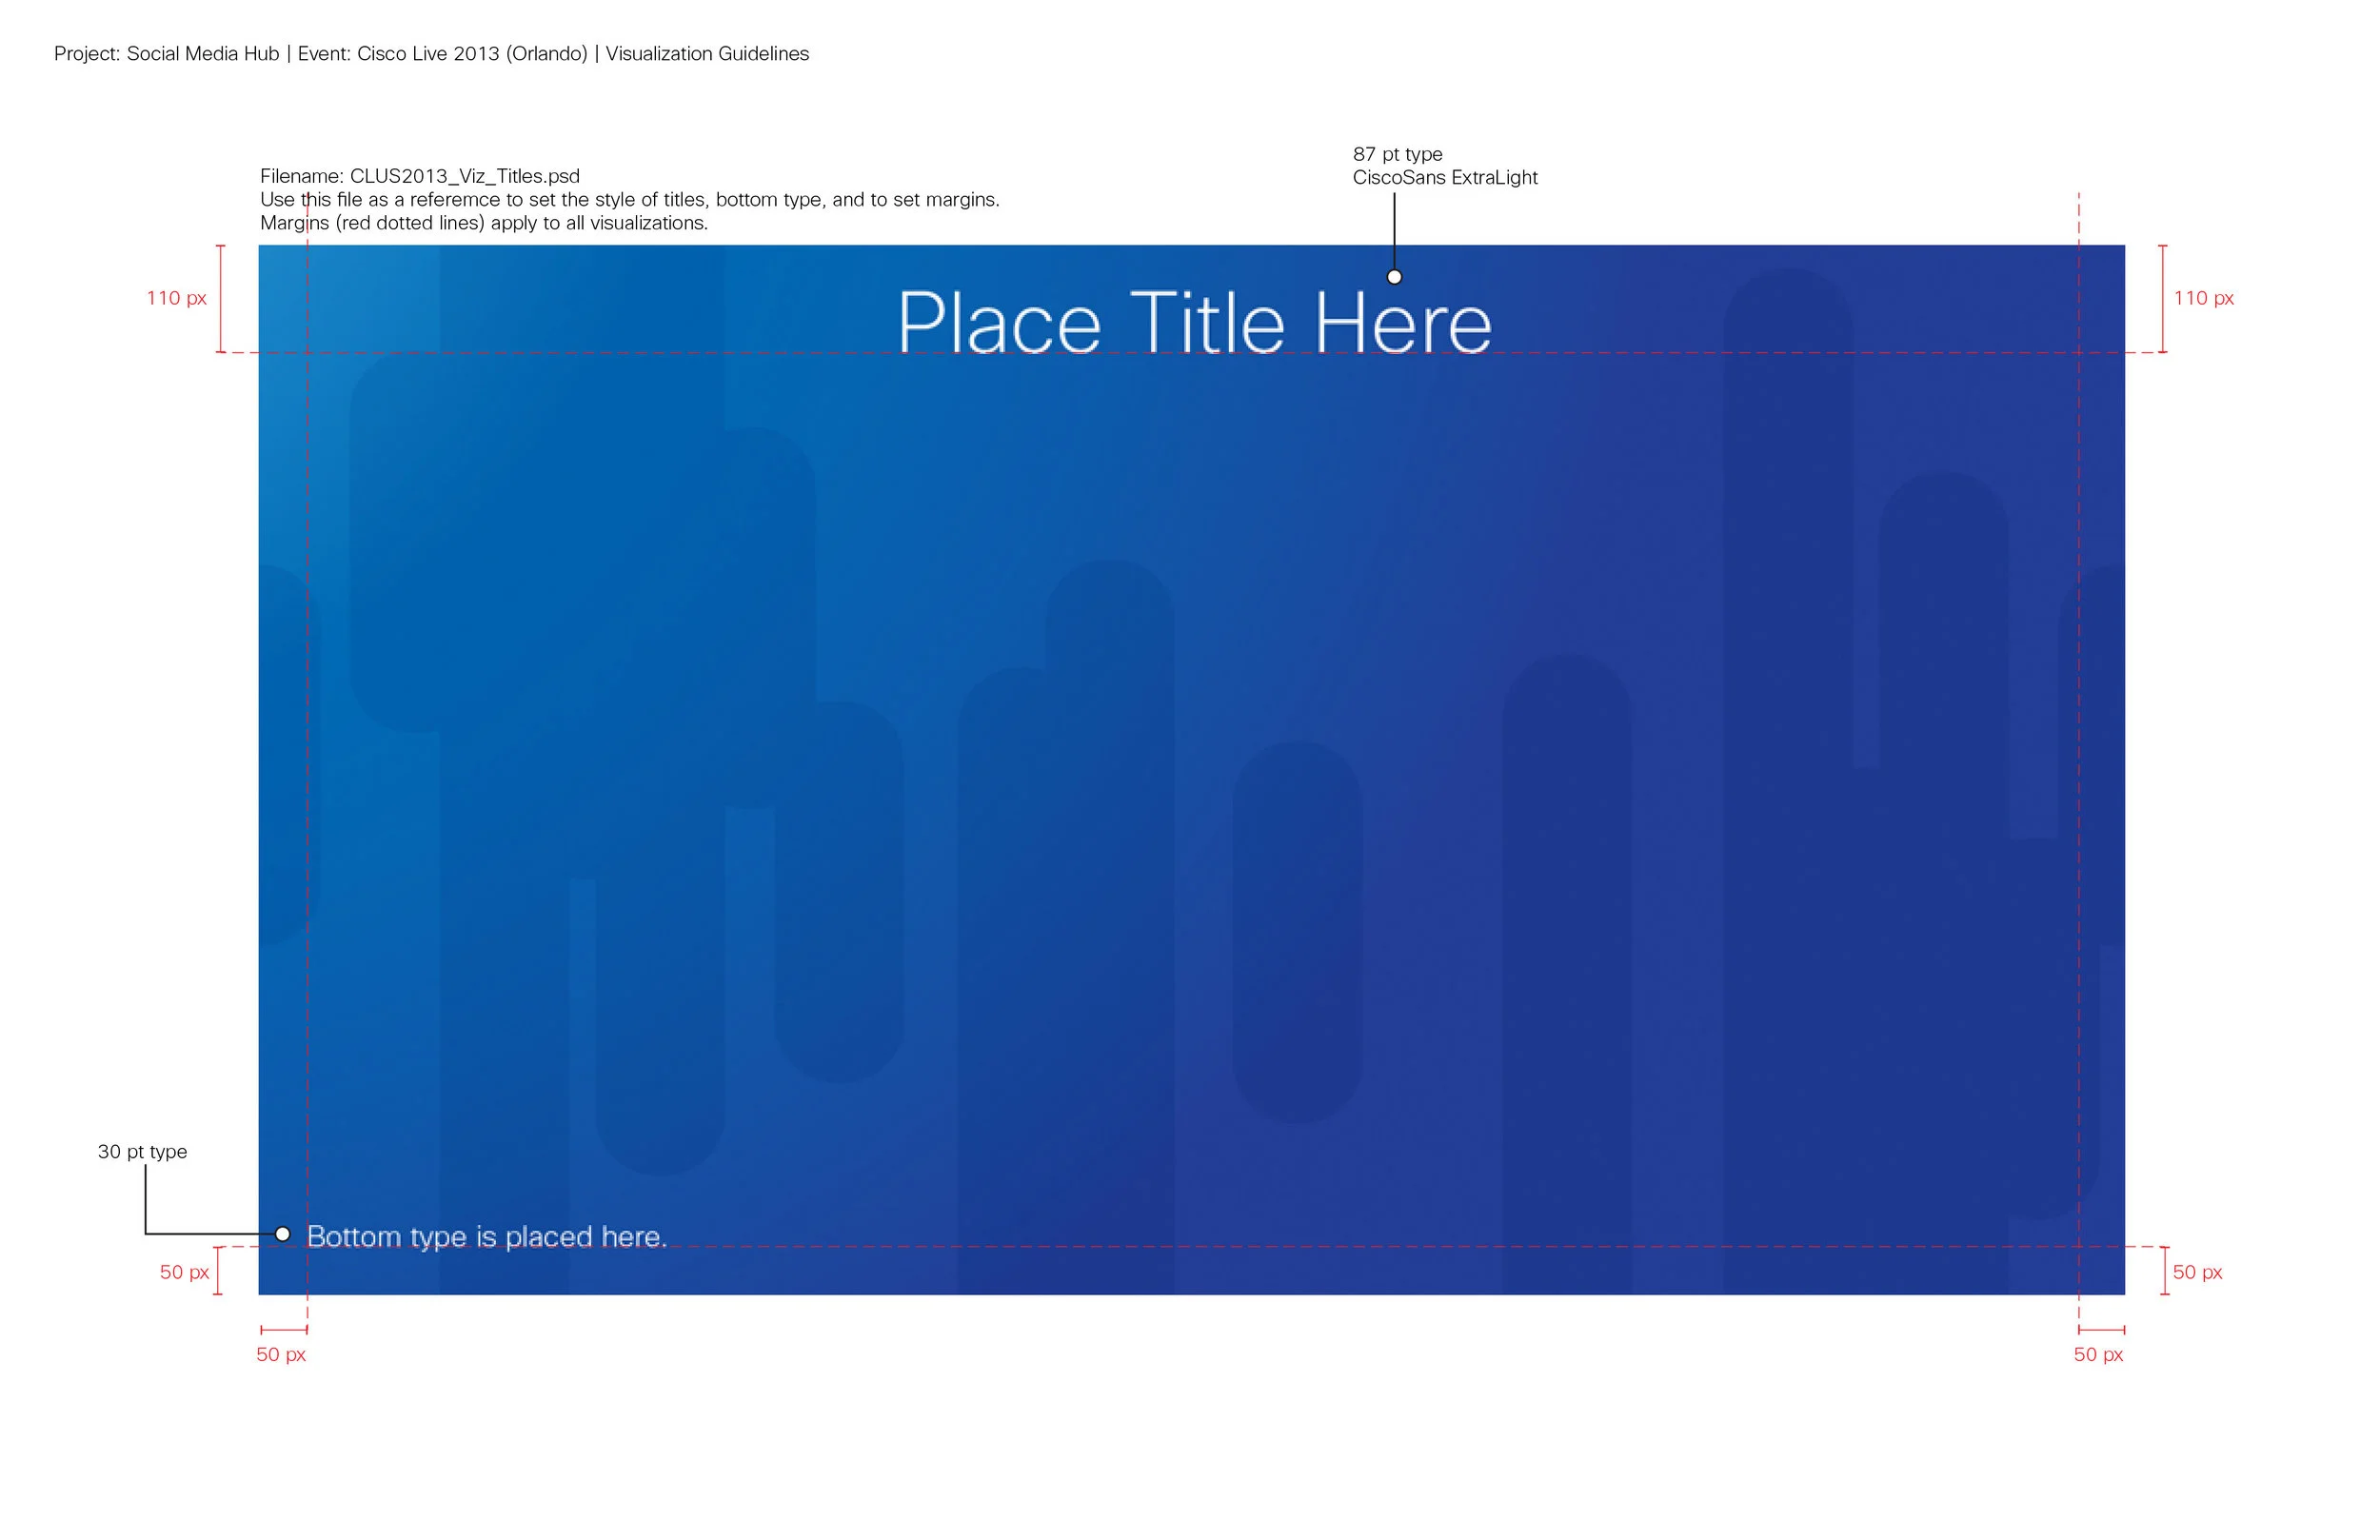
Visualization Guidelines
The guidelines and detailed specifications were provided to the developer in the form of two PDFs: one for the horizontal visualizations, another for the vertical visualizations. The guidelines specified everything from margins, typeface, point sizes, to placement, color, and more. These guidelines, combined with the template PSDs, gave the developer everything he needed to build the visualizations.